
As CEO of InsightSquared, I am extremely excited to share that Mediafly, the leader in sales enablement, is acquiring InsightSquared, creating a world-class revenue intelligence and enablement experience for B2B teams. Having spent three decades in sales and marketing leadership roles and been fortunate to witness several significant disruptions driven by technology, I am convinced of three things: We are on the cusp of advancements that will change the game within the revenue functions of B2B companies. Activity and engagement analytics are the keys to assessing the health of a deal and the strength of the overall pipeline. There will...
BIG NEWS!! Mediafly is acquiring InsightSquared, creating the most complete enablement and intelligence platform. LEARN MORE >
The InsightSquared Blog
Find out the latest in revenue operations, forecasting, analytics and of course the InsightSquared Platform.

Mediafly & InsightSquared join forces to help revenue teams improve forecast accuracy, enhance buyer engagement and increase revenue production. Mediafly, a leader in sales enablement, interactive content and value selling, today announced it has entered into a definitive agreement to acquire InsightSquared, a leader in revenue intelligence, forecasting and analytics. The combined revenue enablement and intelligence platform, a first of its kind, provides customers a 360-degree view of what’s happening at every stage, in every account to improve coaching, engagement, predictions and execution throughout the customer journey. Despite a digital-first selling environment, today’s B2B revenue leaders forecast, prioritize and create...
Is your sales team getting the most out of their data? If you’re like most companies, the answer is, unfortunately, probably not. In fact, a 2018 study by Gartner indicated that a whopping 87% of organizations have low business intelligence and analytics maturity. Yes, you read that right. Almost 90% of companies aren’t benefiting from their data in all the ways they could—and should—be. So what’s the answer to this problem, and how do you develop better business intelligence and data maturity? It’s a pretty big issue to solve with any one strategy. However, using sales metrics dashboards that are...
Let’s face it, you can’t win them all. This is a lesson we are forced to learn at an early age. Whether losing a board game to your older sister, a fantasy football game to your best friend or putt-putt vs your significant other, at some point we all come to terms with the fact that victory all the time is impossible. I know it, you know it, and Sales VPs certainly know it. What matters is that we learn from our losses and apply these lessons to future opportunities. This is why the win-loss analysis is a critical aspect...
"Do we have enough pipeline?" Sales leaders hear this sentiment in their sleep. It's what drives them. It's also their #1 challenge. Historically we've seen this question answered by looking at pipeline coverage. Do we have enough pipeline heading into a specific period to succeed? Unfortunately, CROs aren't always given enough factual information about the health of a funnel to see a clear picture. But, why? Before they can answer whether or not salespeople can hit their numbers, it's essential to break down how they are established. Where do revenue expectations originate? And how accurate and helpful are they in...
Does your forecast process have room for improvement? Unsure where to start? Sales Forecasting informs every layer of your business, from individual revenue goals to the implementation team's staffing strategy to product expansion. Confident in your forecast for growth? You can move fast when it comes to hiring and roadmap innovation. Unsure, decisions get much trickier. According to the 2021 State of Sales Forecasting Report: 68% of participants missed their forecast by more than 10% 9 out of 10 reported missing their predicted forecast by 6% or more Only 52% acknowledged even measuring forecast accuracy Suffice to say, there's significant...
Looking for Sales Dashboard examples and templates? You're not alone. Everyone wants to be data-driven. But too many people take the wrong approach when it comes to analytics – they lack focus and intent. They report reactively, as opposed to monitoring the data in real-time, even better, predicting, so they can coach and optimize. Why Use Sales Dashboards? Sales teams move fast. And their progression towards goals impacts almost every area of the business. From marketing to implementation, product to finance. On a daily basis, revenue leaders have critical questions they must answer — and the answers must be rooted...
We don’t have to tell you: the importance of your sales forecast is undeniable. It drives countless decisions across your organization and provides a view into future revenue levels based on consumer behavior and buying trends. Your forecast even helps guide performance goals for the company moving forward. Yet the benefits your forecast provides are almost completely nullified if the data driving it is inaccurate or incomplete. Getting an accurate forecast is the name of the game. But forecast accuracy is dependent on the quality of the CRM data feeding it. The bad news is, CRMs aren't connected to the...
Modern Activity Reporting and Dashboards. Machine-Learning Guidance. Embedded in Bullhorn. The next-generation Staffing Platform platform is here. See how the InsightSquared Platform for Bullhorn will help you gain a competitive advantage, understand what’s happening in your organization, and use data to effectively drive the change you want to see. WHY A NEW, MODERN APPROACH TO BULLHORN REPORTING For the last 10 years, InsightSquared has helped recruiting firms get more from Bullhorn through dashboards and reports. Over that time the technology landscape has continued to evolve. Recruiting companies’ needs have also undergone significant changes. Not only have they navigated ongoing workplace...
We’re in the midst of a RevOps revolution. In fact, according to Gartner, by 2025, 75% of the highest growth companies in the world will deploy a revenue operations (RevOps) model. But what is Revenue Operations and why is has it become so critical? Whether you’re just starting your journey or on a team that’s scaling, we’ve created this comprehensive RevOps overview and glossary of revenue operations terminology and KPIs for your reference. It’s our mission to help businesses make better decisions so they can take control of the revenue journey. And there’s no better driver of great decisions than...
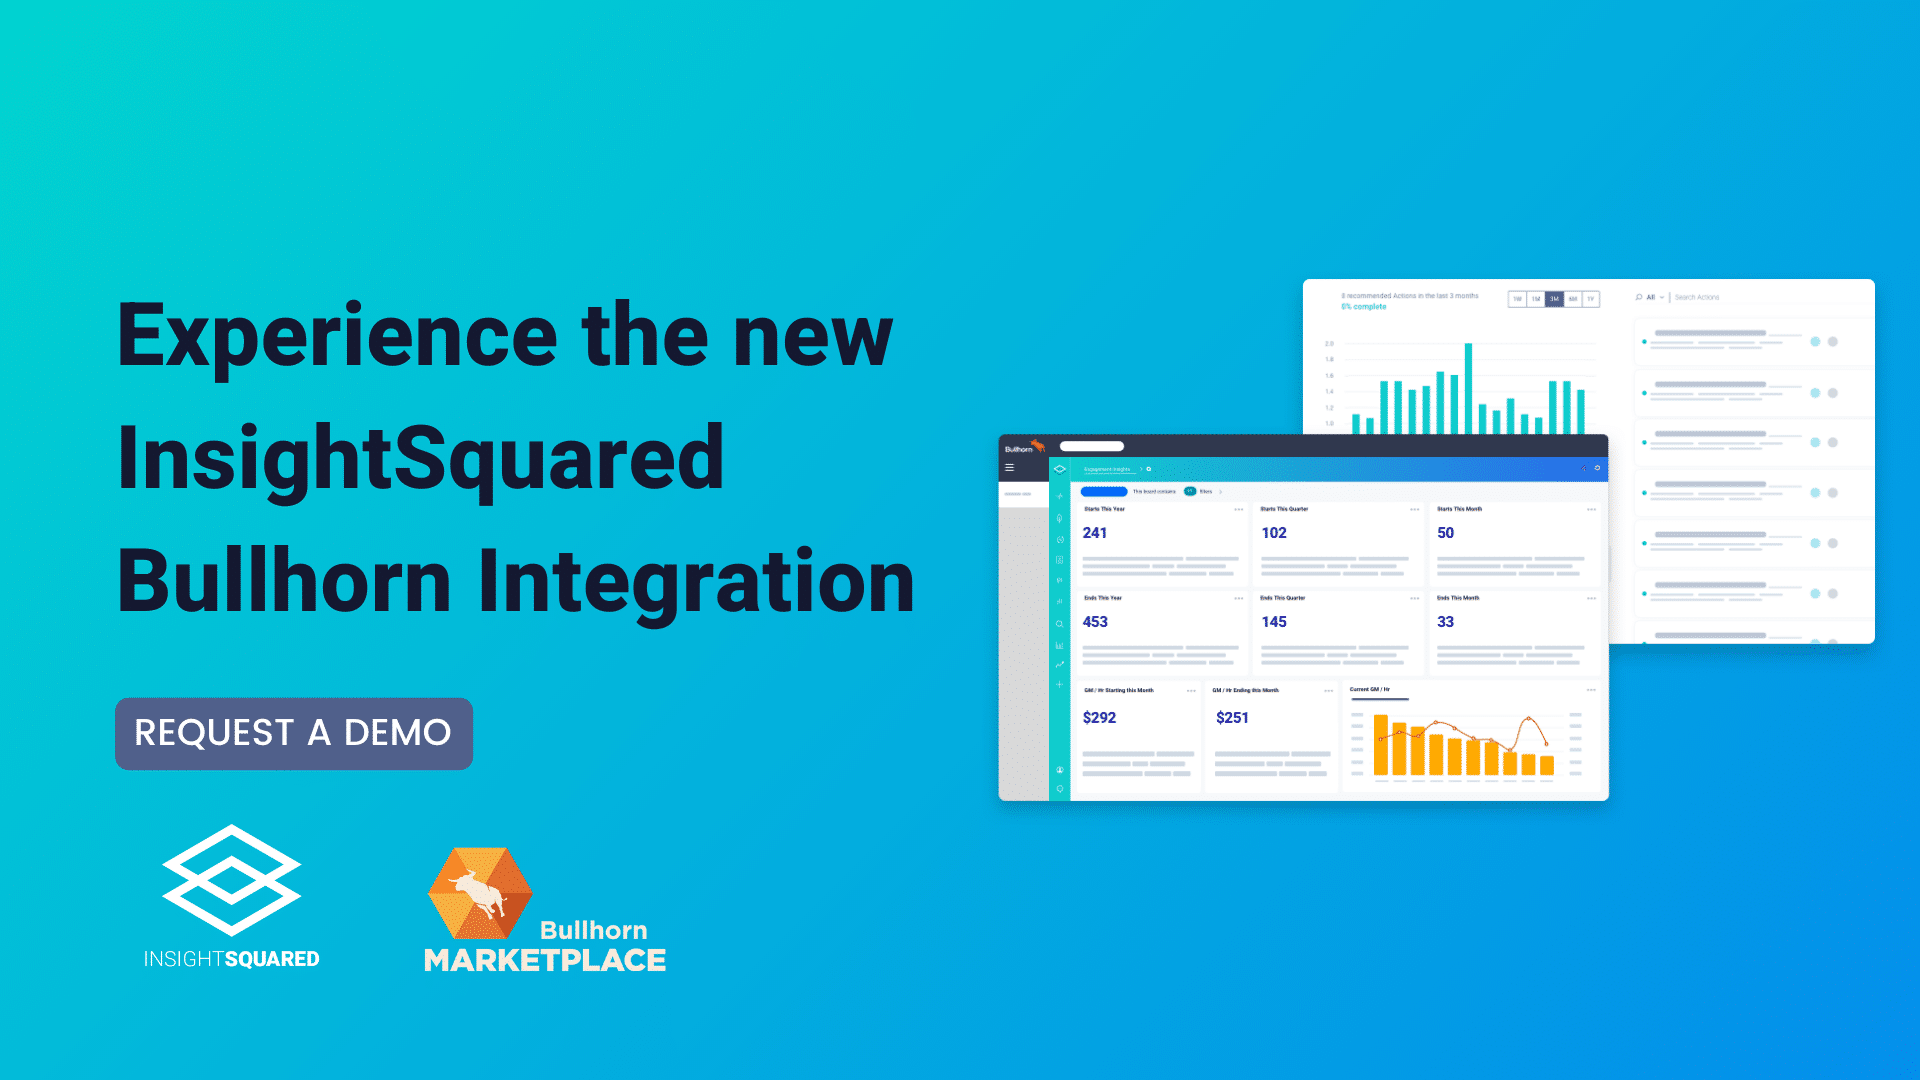
InsightSquared Unveils Predictive Analytics and Activity Reporting for Staffing Industry Now available, InsightSquared for Bullhorn delivers best-in-class activity reporting, dashboards and machine-learning insights to drive more placements and revenue BOSTON — JUNE 15, 2021 — InsightSquared, the leader in revenue intelligence, today introduced the InsightSquared Platform for Bullhorn, a modern activity reporting and dashboarding solution that helps recruiting firms gain a competitive advantage using data. With the new platform, recruiting firms can go beyond traditional reporting such as the number of submittals, interviews and notes, to understand exactly which activities, or combination of activities, led to successful placements and most importantly, why....

InsightSquared and RingLead Partner to Deliver a Complete, Accurate View of Contacts Throughout the Buyer's Journey New integration provides automated enrichment and analytics of contacts identified during active sales cycles and customer relationships to reduce risk and improve forecast accuracy. Sign up for a demo of RingLead + InsightSquared today! BOSTON — JUNE 8, 2021 — InsightSquared, a leader in revenue intelligence and forecasting, and RingLead, a leader in data orchestration and RevOps automation, today announced a strategic partnership providing customers a unified, accurate view into every prospect and customer, their activity and their influence—throughout the buyer’s journey. The new integration...
