What Revenue Operations & Intelligence Buyers Should Look for
GUIDE
350+ Reports & Dashboards Mean Fast Time to Value
Your business is changing quickly. That’s why we have hundreds of preconfigured sales, marketing and customer success reports ready for you to deploy.
Download the Guide →
ON DEMAND
Hear how Brightcove is improving rep effectiveness, execution and overall predictability with InsightSquared.
Watch now →
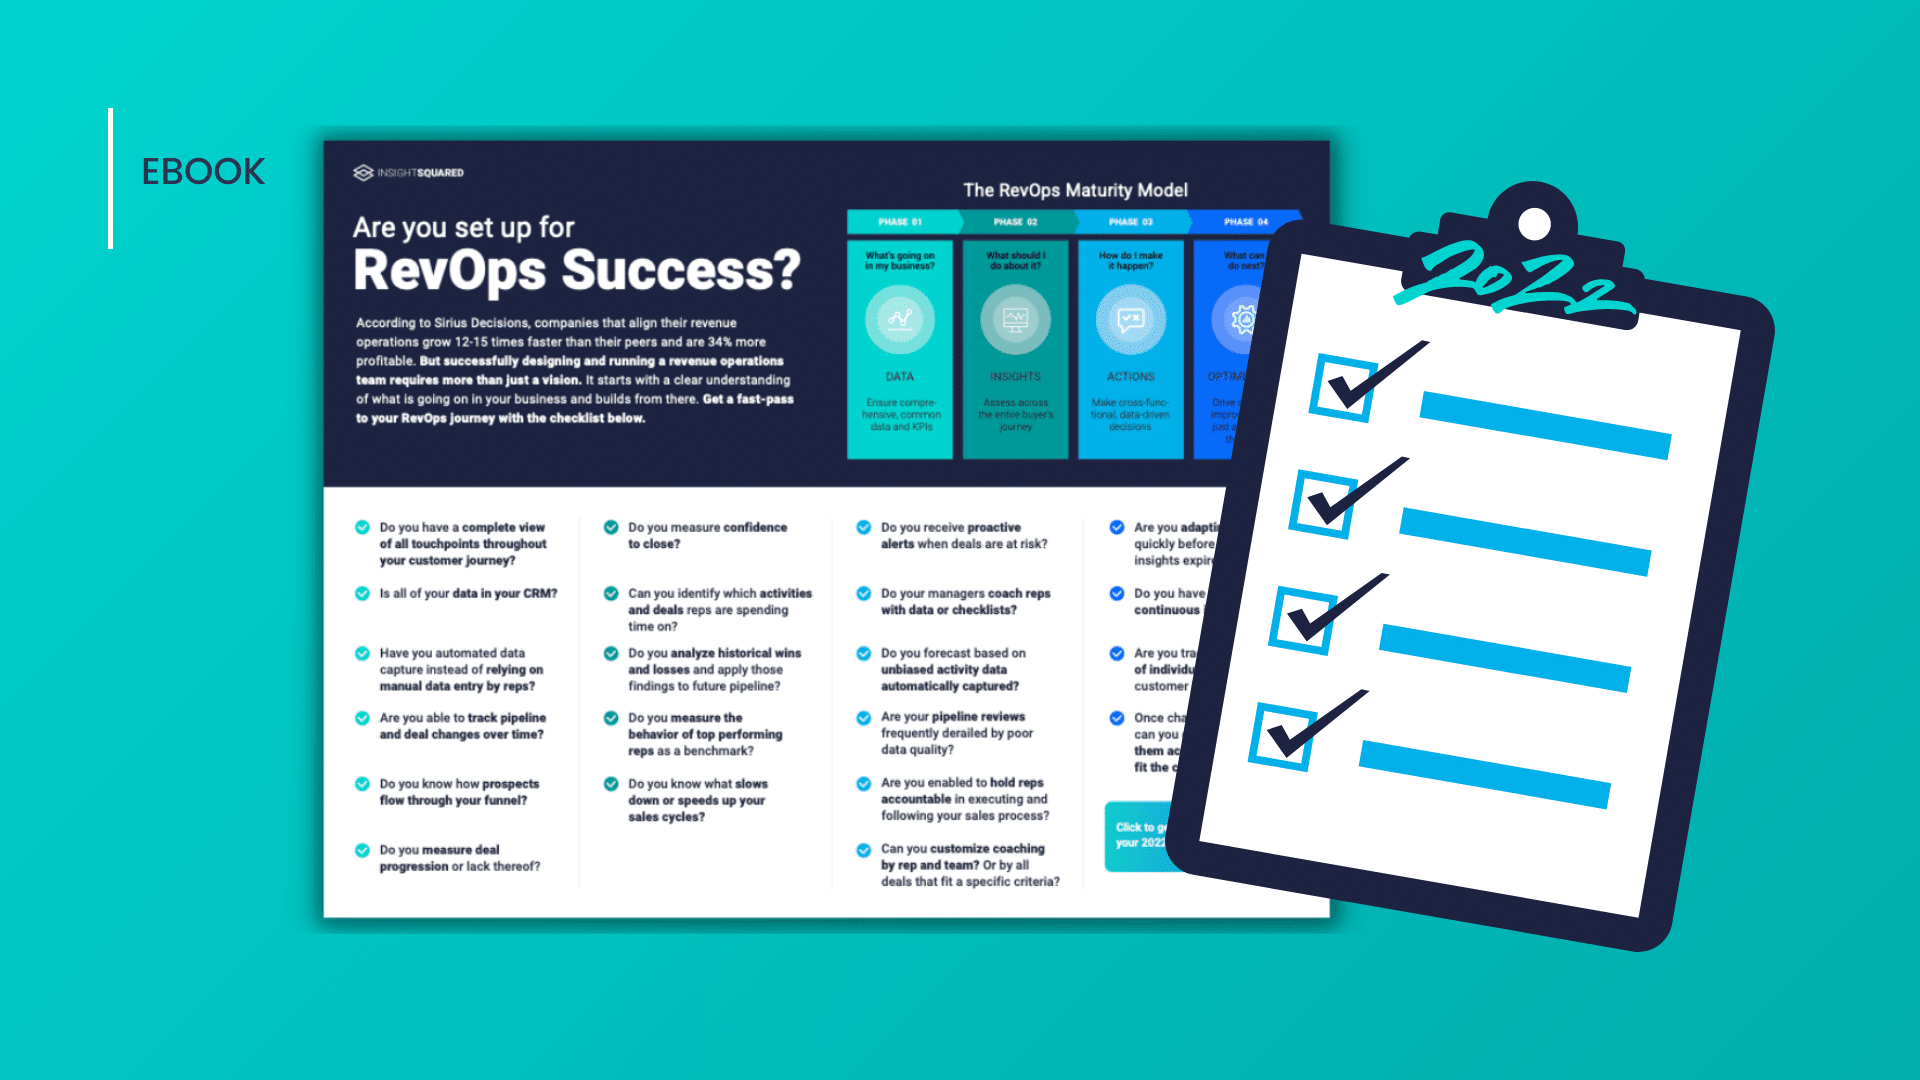
Identify gaps in your organization and assess your RevOps maturity with this checklist.
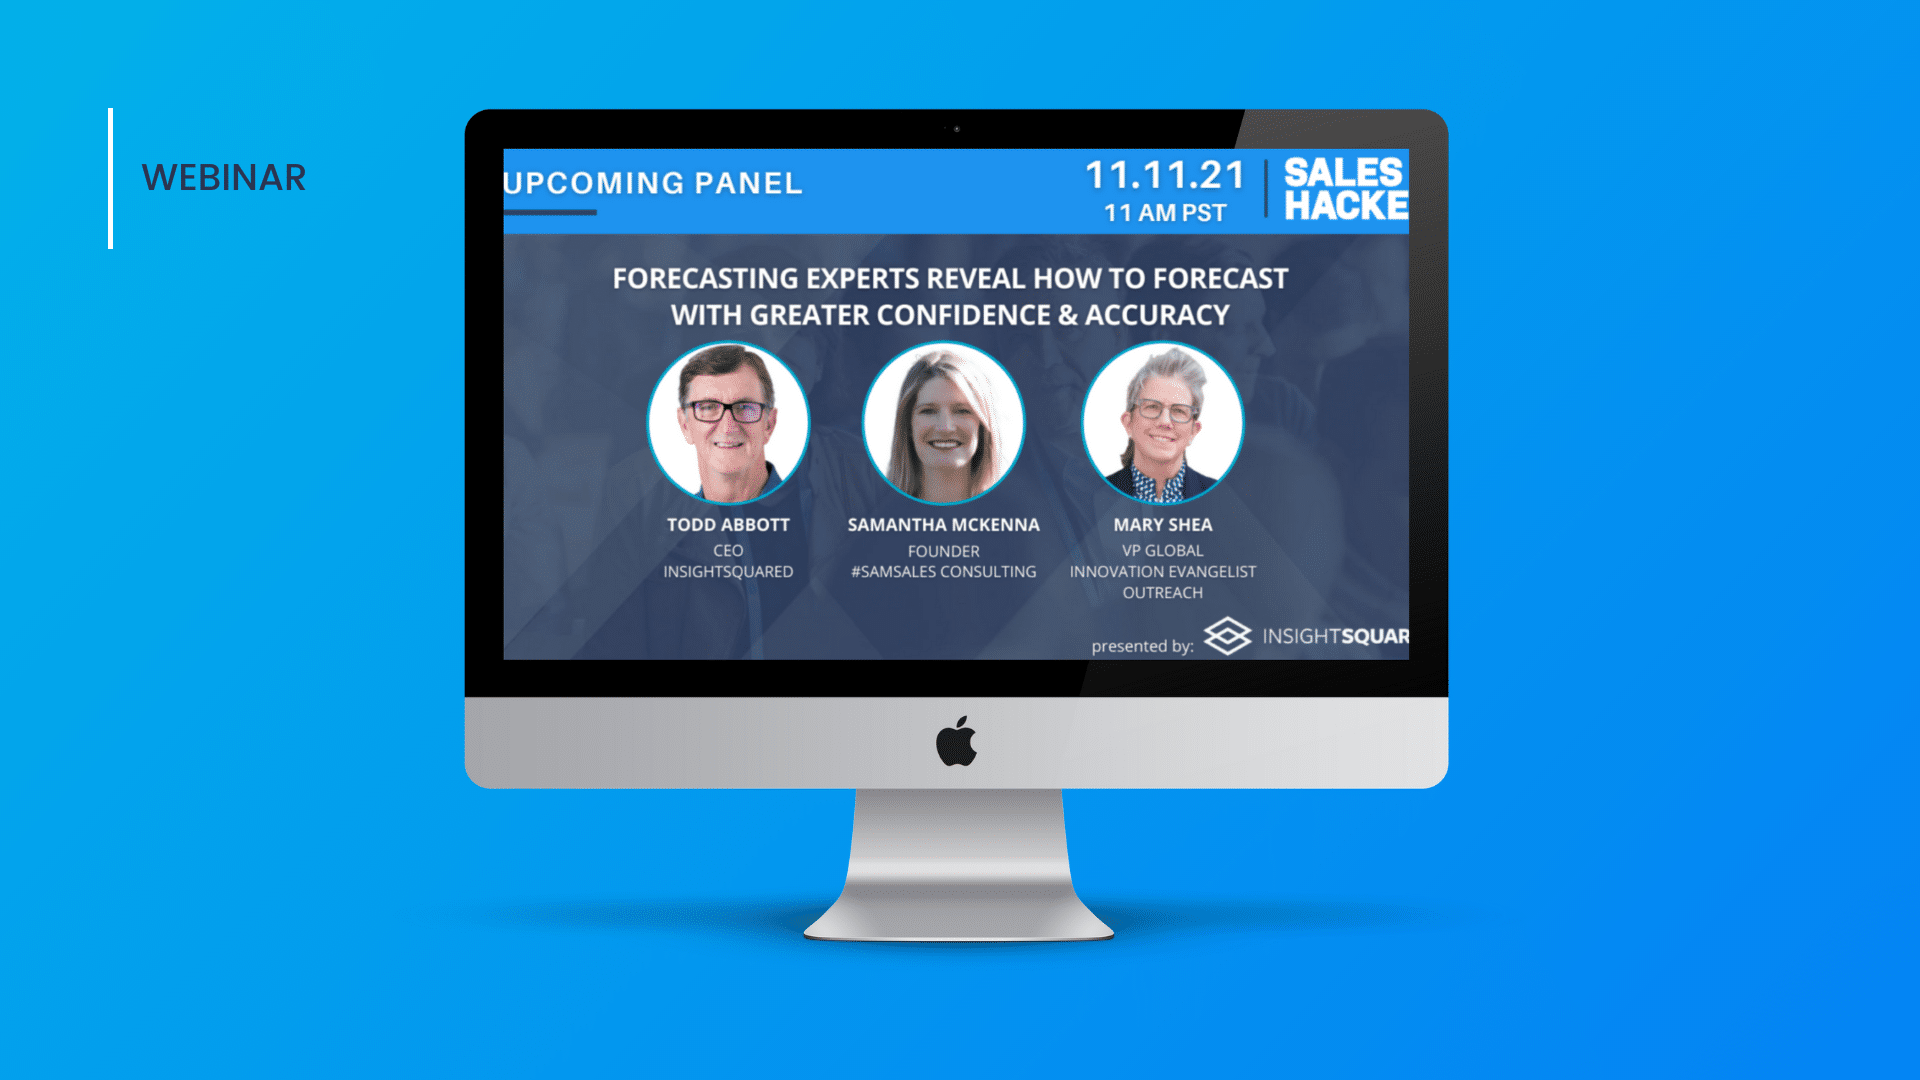
Forecasting Experts Reveal How To Forecast With Greater Confidence & Accuracy
From identifying bottlenecks and win/loss analysis, this guide dives into the top ways to accelerate your pipeline and win more.

How much time do your reps spend chasing dead deals? InsightSquared makes identifying stalled deals easier than ever.
With the pace and complexity of B2B sales cycles, alignment is key. If your team isn’t seeing desired results, you could be missing a crucial piece of the puzzle: Revenue Operations (RevOps).
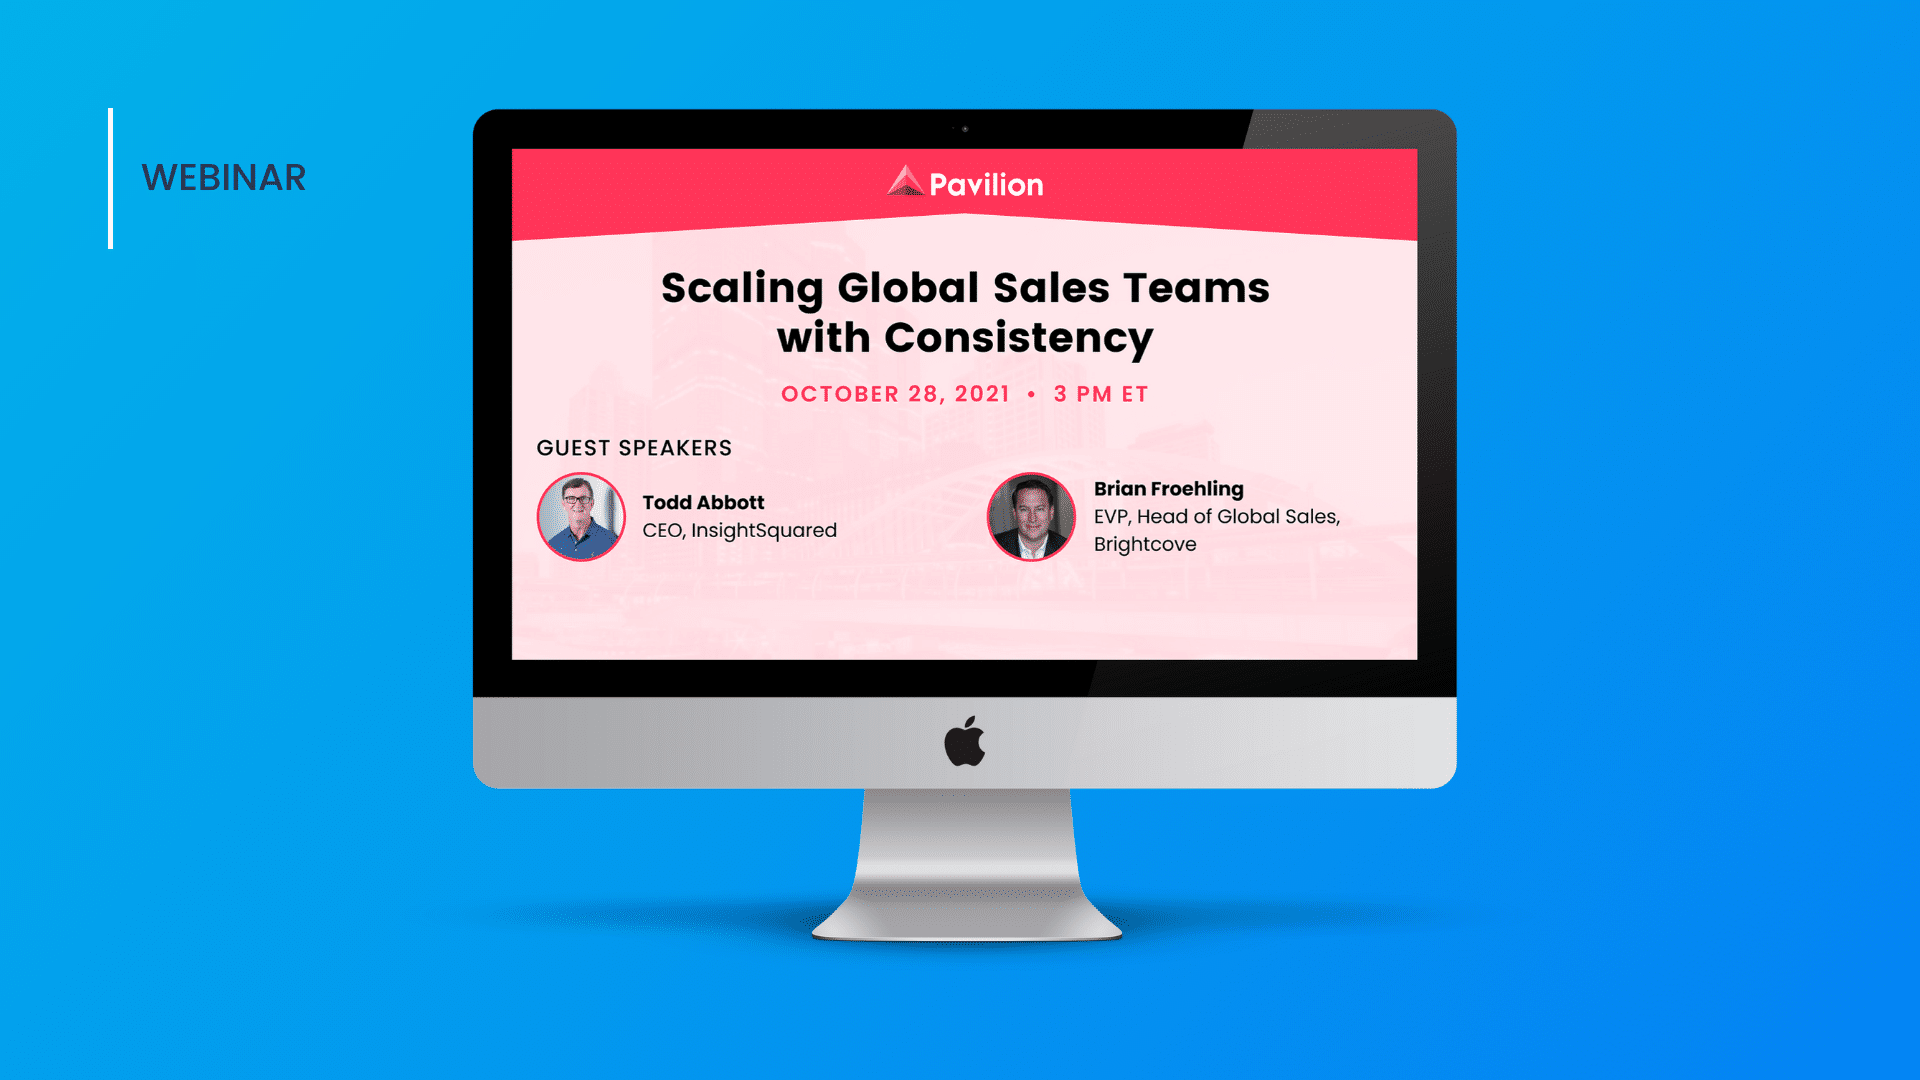
Watch the on-demand replay to hear lessons learned with instilling a disciplined sales management culture across all layers of the company’s global sales team.
Enrich your CRM data, improve productivity and gain full visibility into your pipeline with InsightSquared's automated activity capture.
If you don’t, you’re not alone! Lack of trust in CRM data is consistently reported as the second highest reason for poor forecast accuracy.
Join us for a 30-minute step-by-step interactive demo where we’ll walk through Win/Loss dashboards and best practices for analyzing deal outcomes.
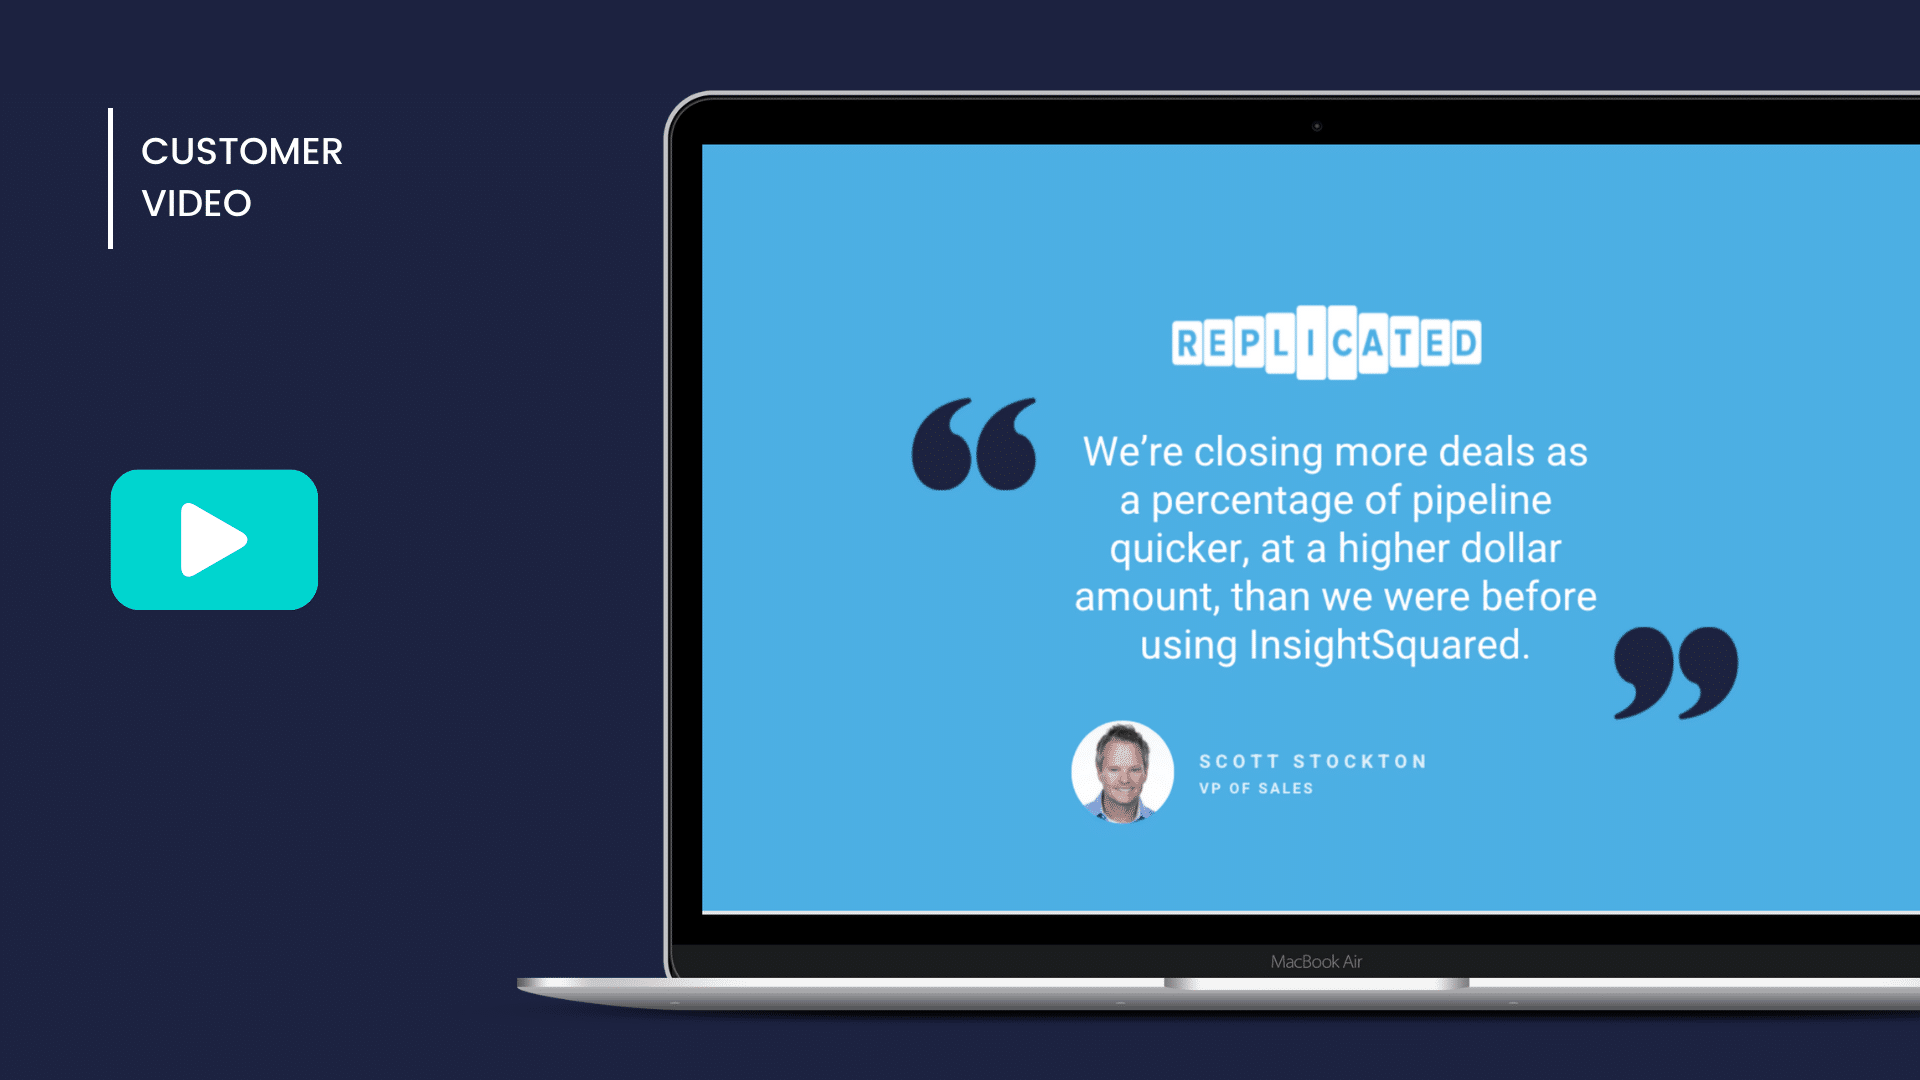
See how InsightSquared customer, Replicated, is closing more deals as a percentage of pipeline.
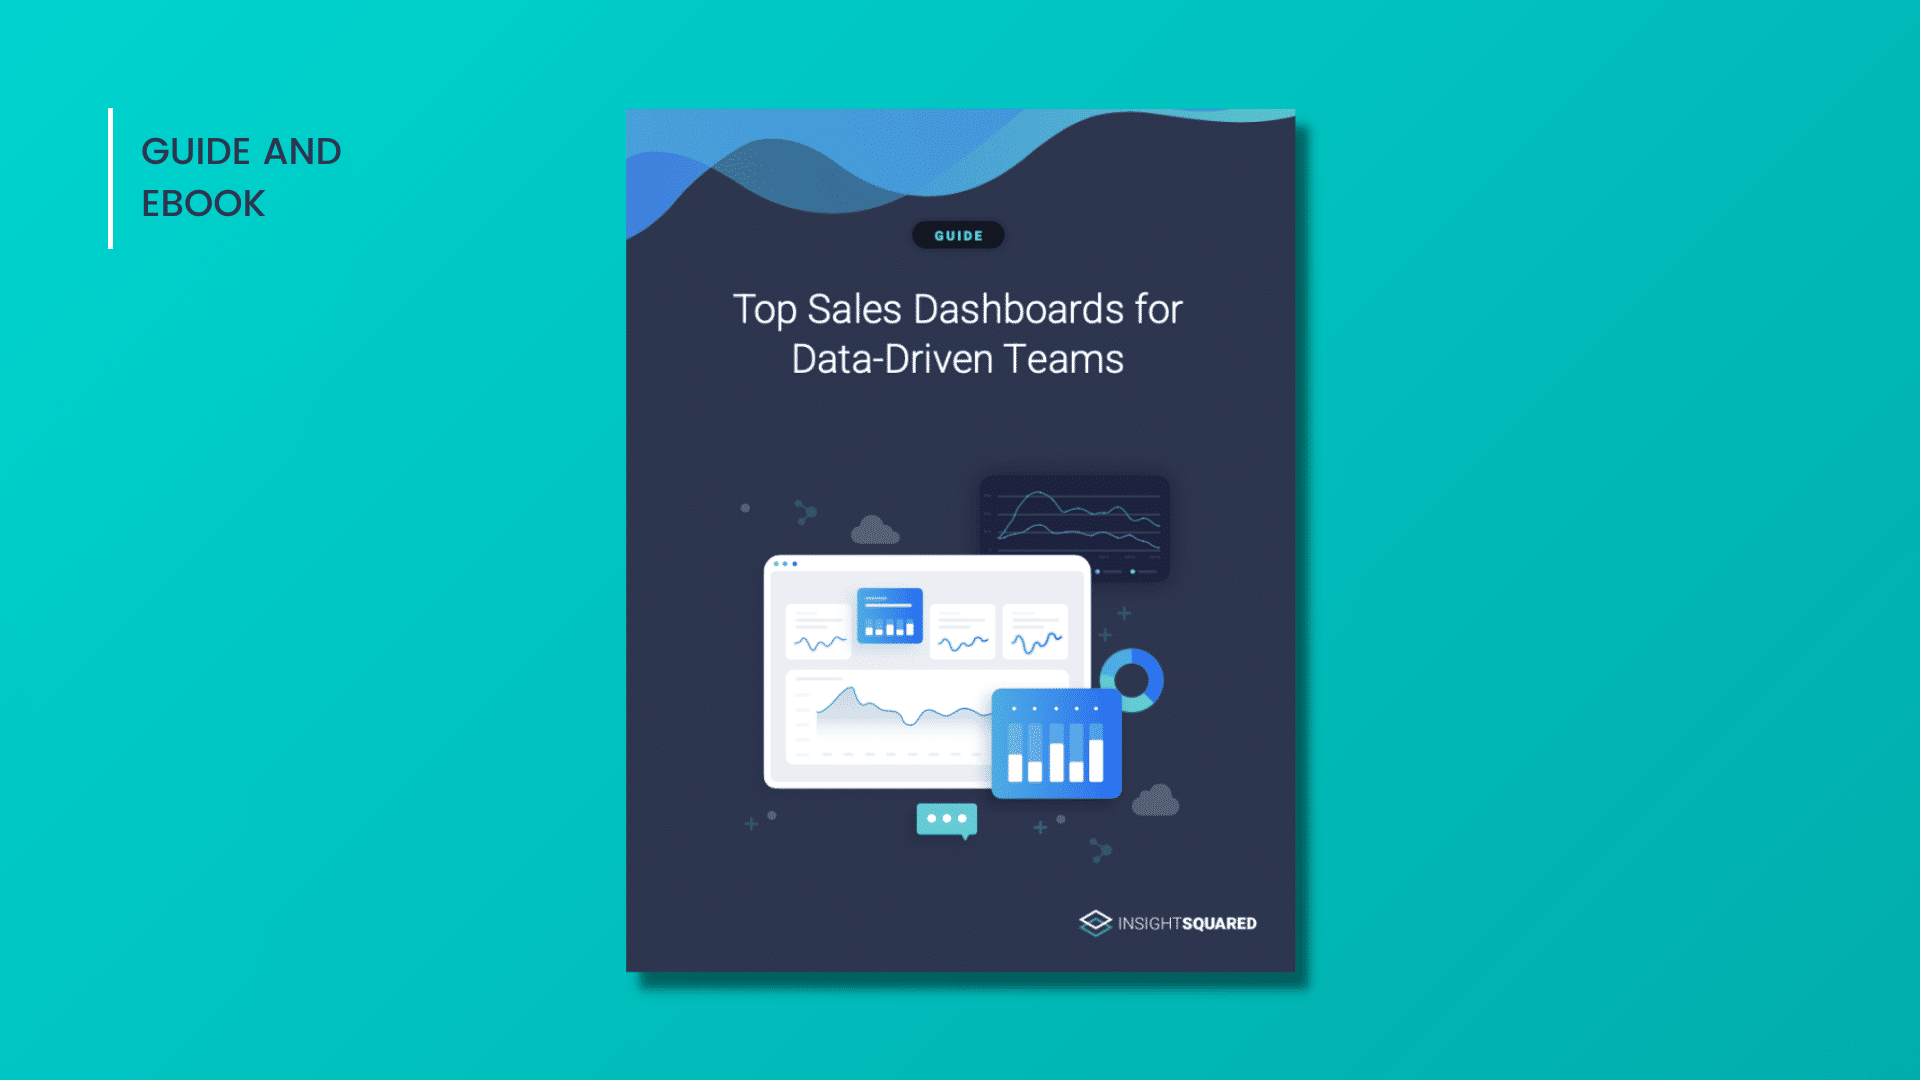
Sales dashboards provide data-backed answers to your questions with the click of a button, but what data should you include?
In this 30 minute webinar we’ll unveil some of IS2’s newest features and show you exactly how to spot risk, where to coach and where to cut bait.
Dive into the roles that revenue leaders play in driving alignment, providing data-driven objectivity, and making strategic decisions.
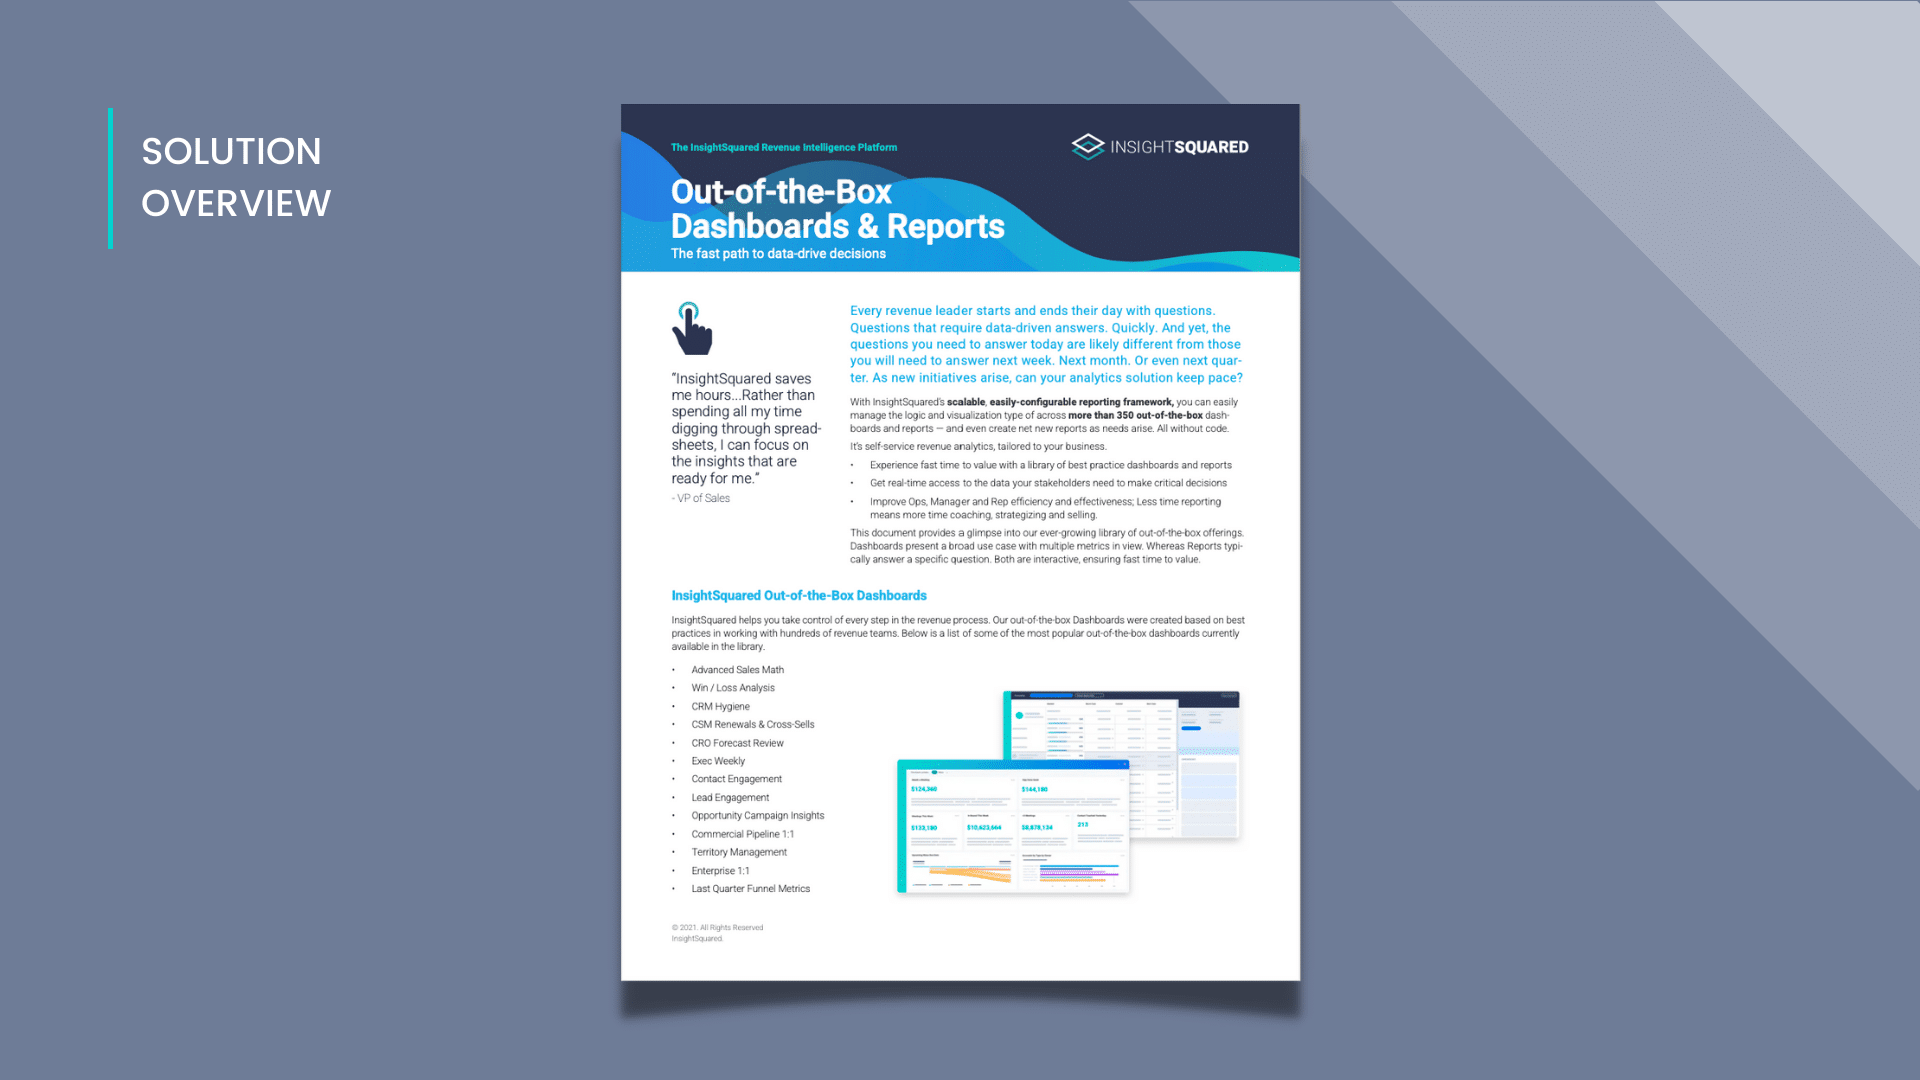
InsightSquared’s robust library of out-of-the-box reports and dashboards is here for you. Launch them as is, or easily configure based on your team’s goals, all without code.
Join us to learn how to effectively identify and engage with the complete buying groups at your target accounts, align revenue teams internally, and achieve visibility and predictability into your pipeline.

Assess your forecast accuracy with our new Forecasting Benchmark Tool.
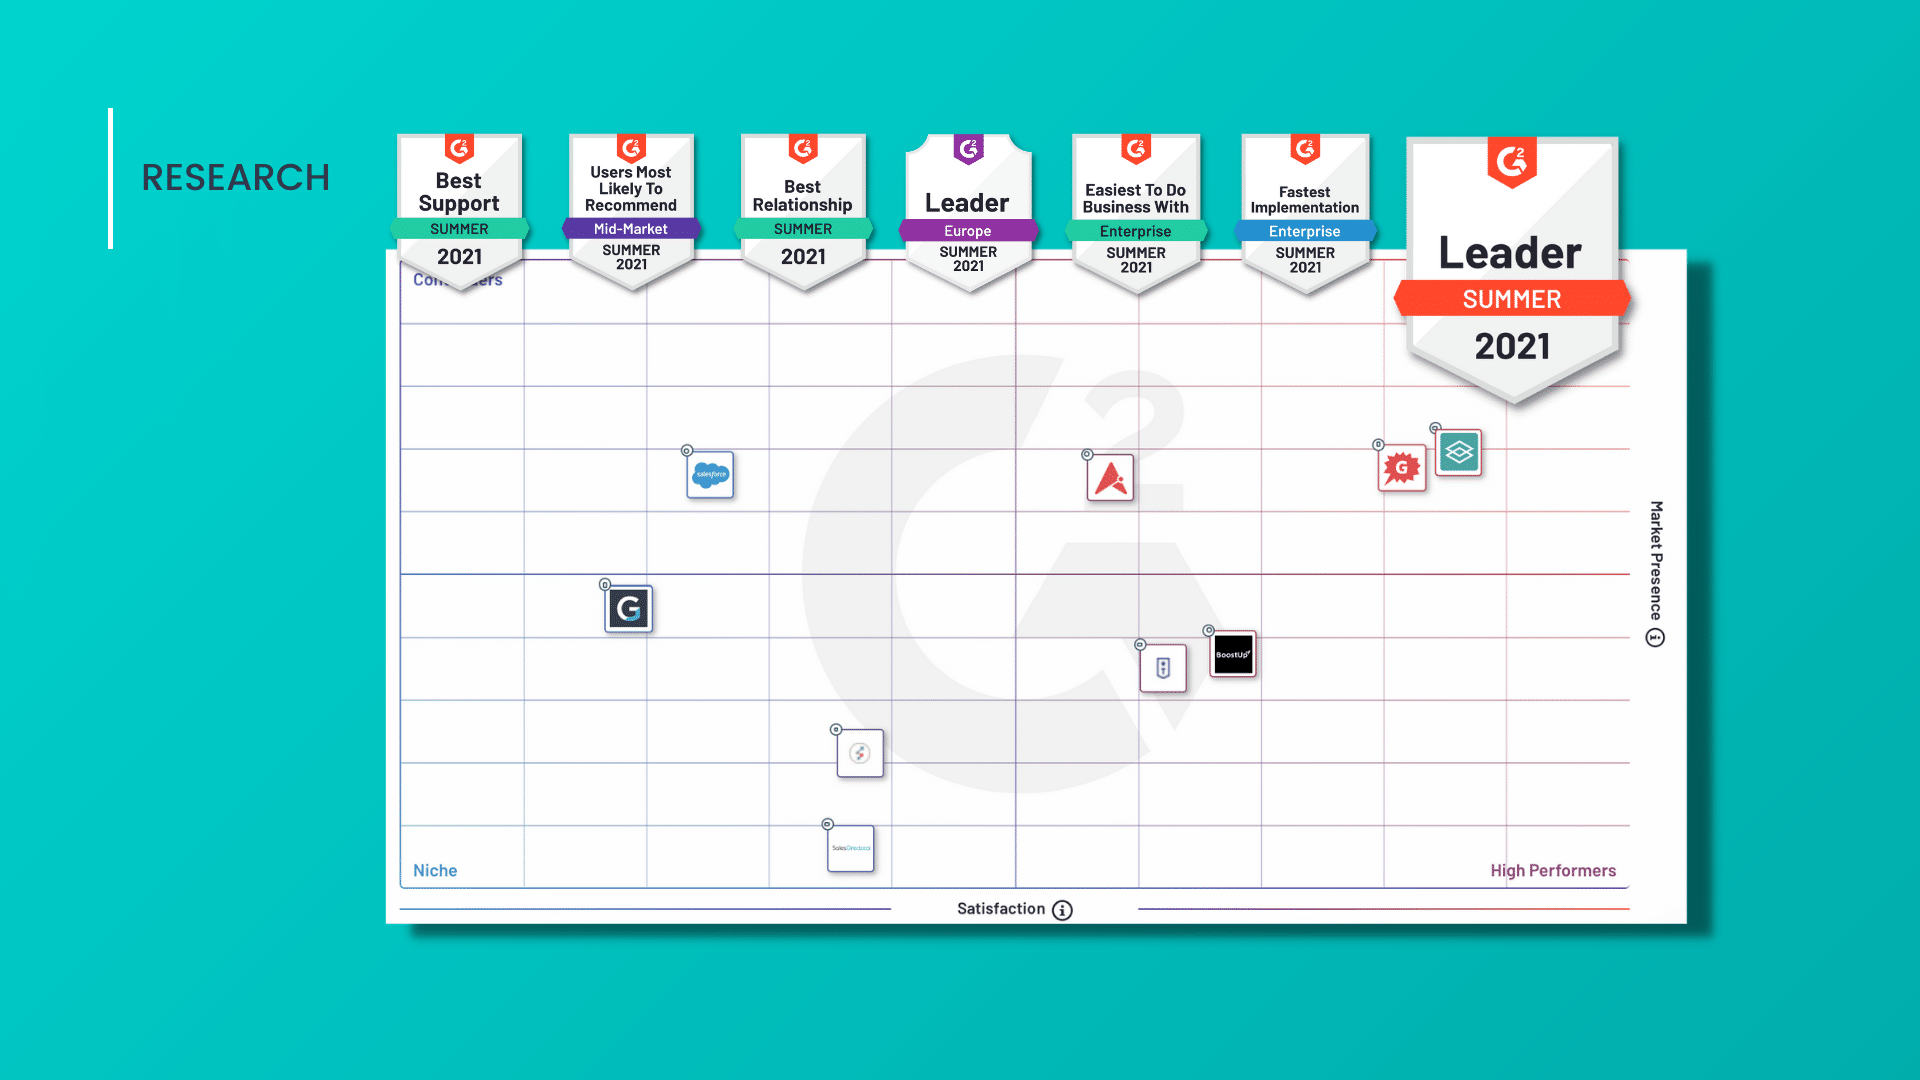
InsightSquared named a leader in G2’s newest growing category: Revenue Operations.
Join Outreach, Bombora, Mediafly and InsightSquared as we dive into underutilized insights from across the customer journey, and discuss how you can use them.
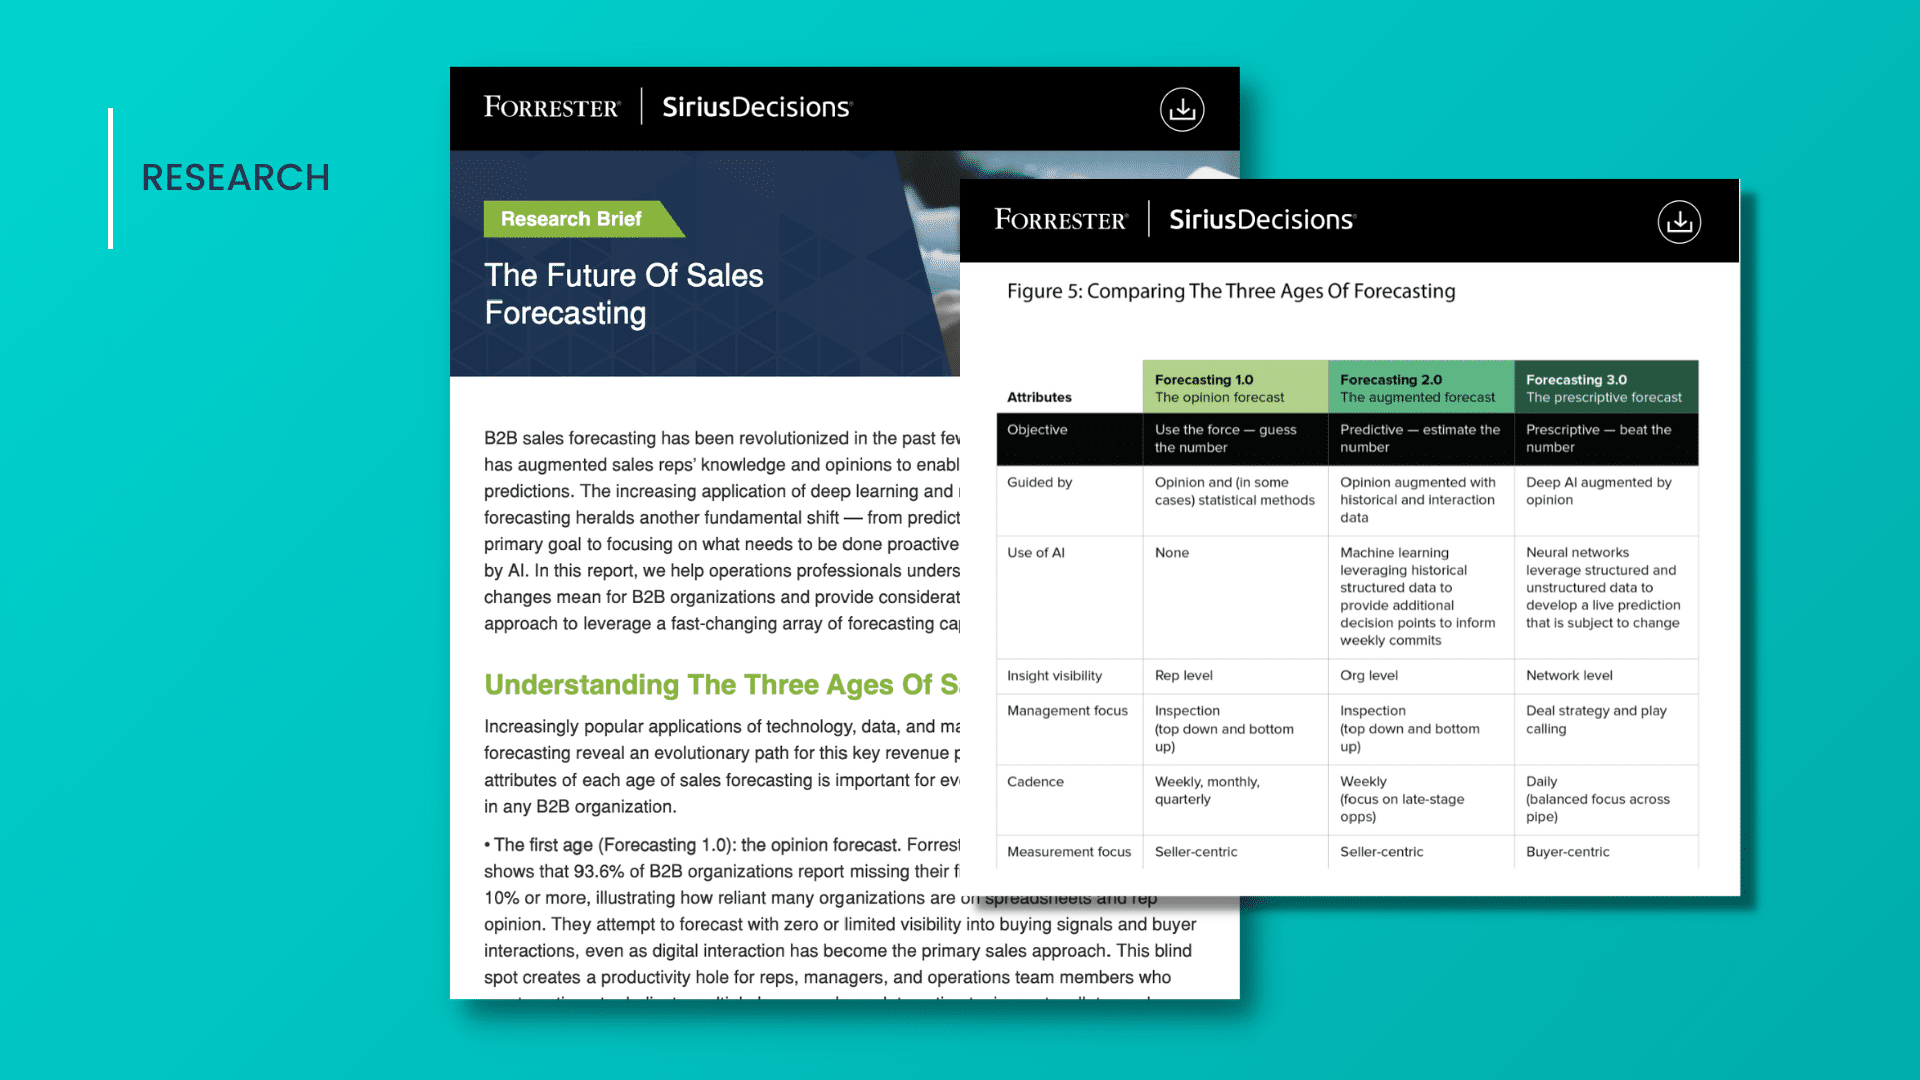
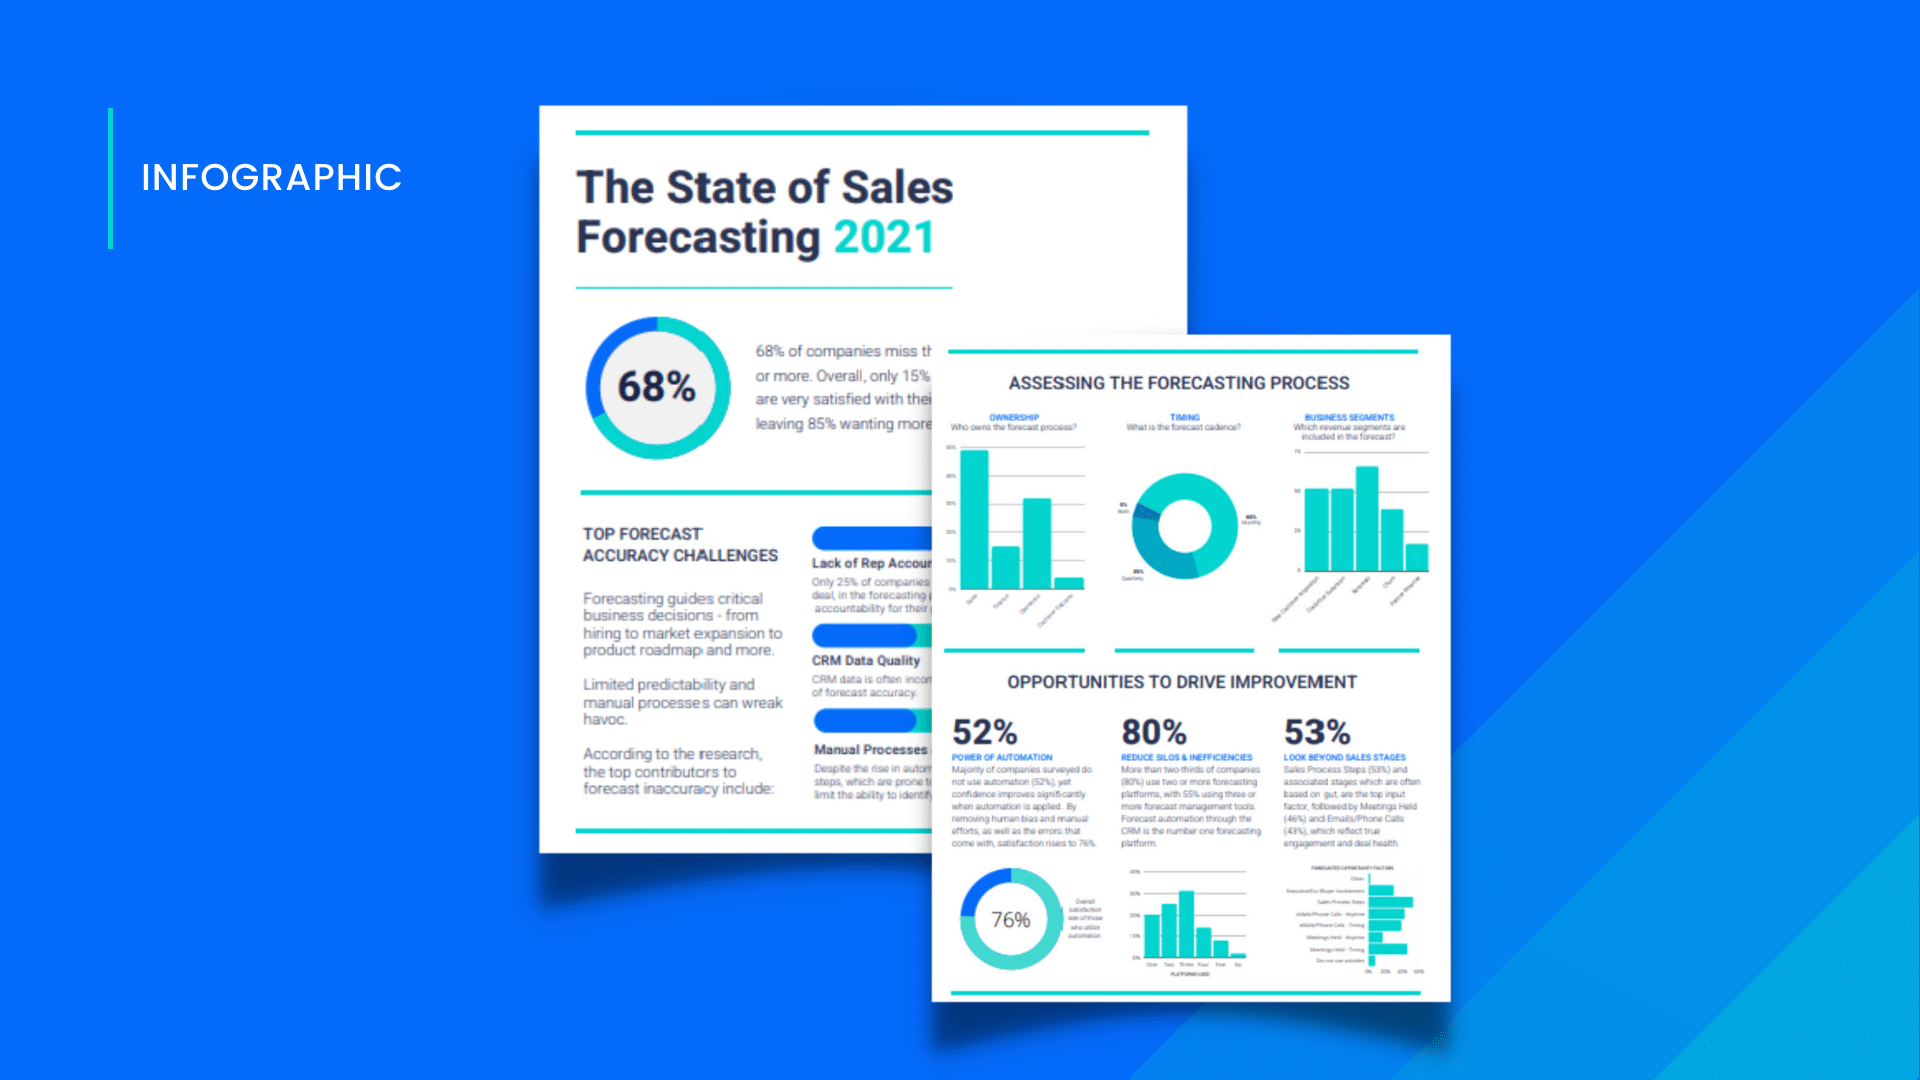
Examine the current state of forecasting and unearth recommendations on how to future-proof your forecast strategy.
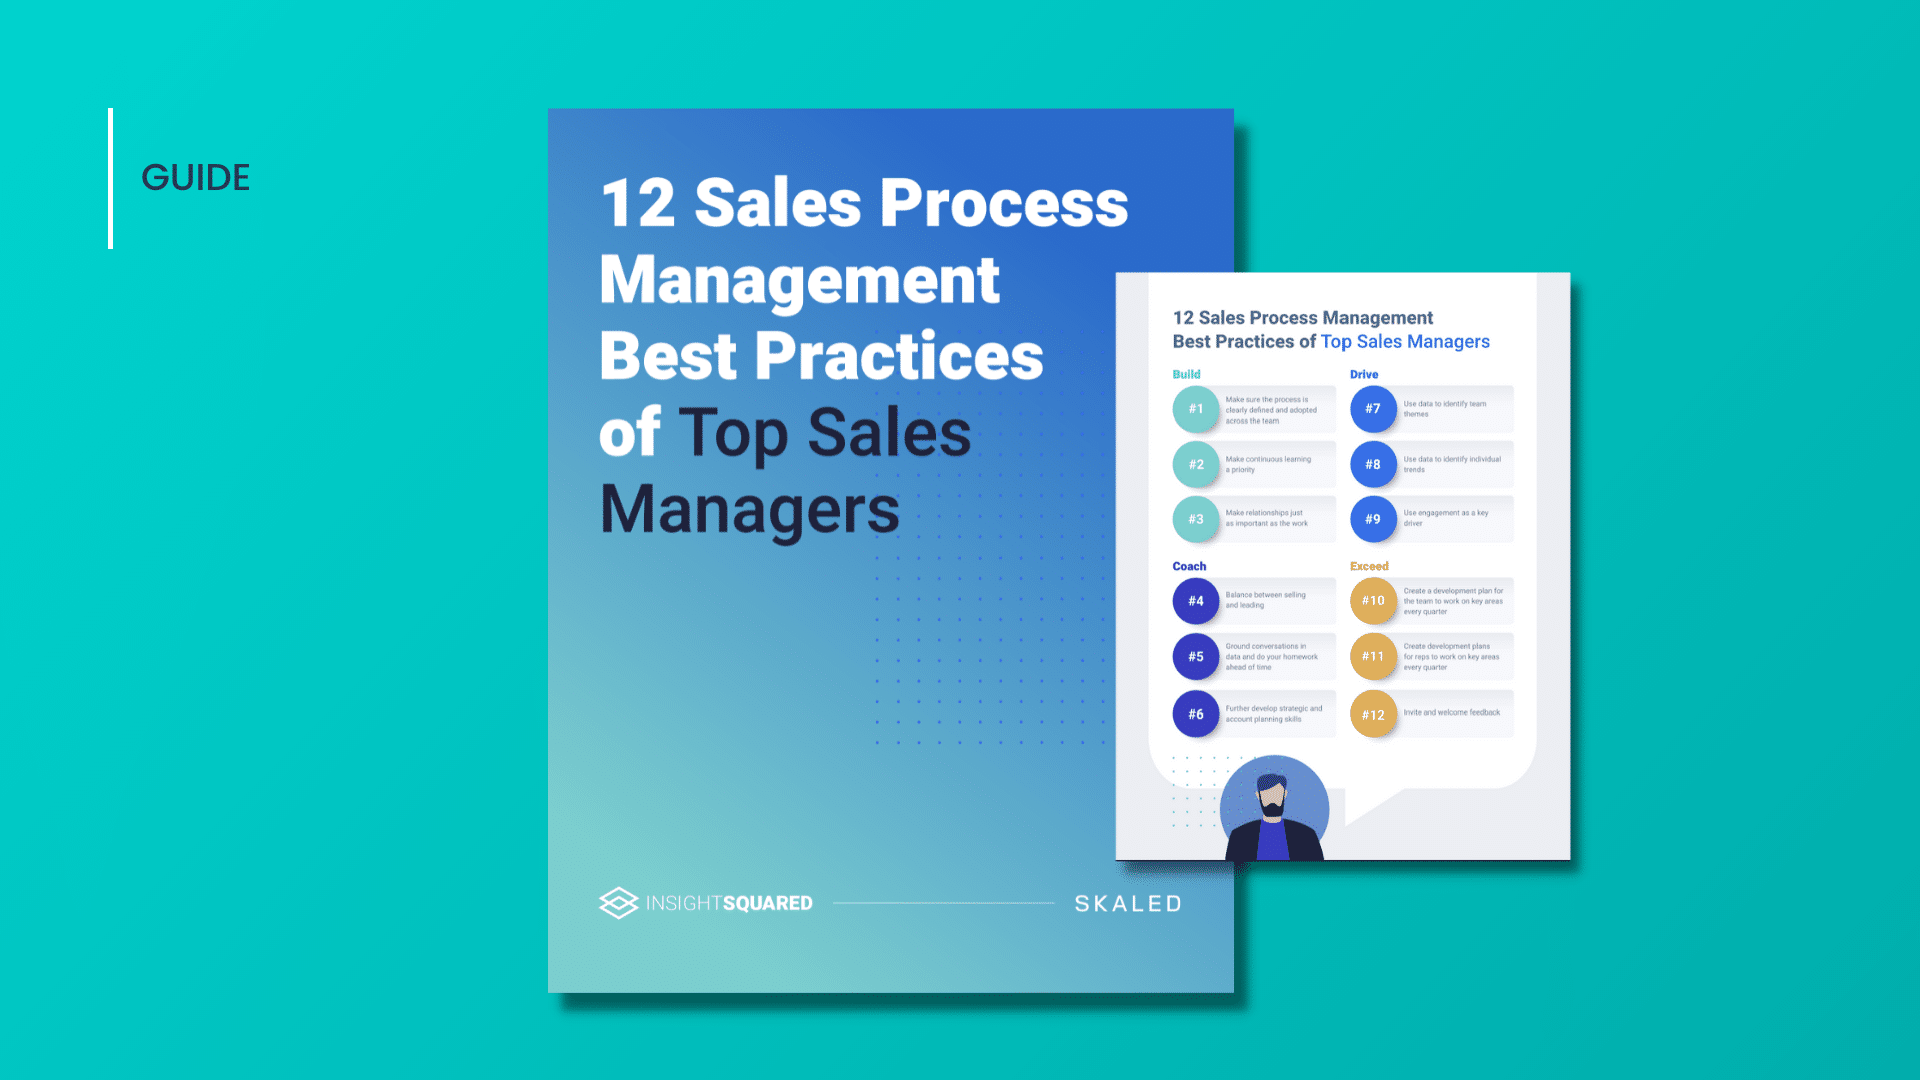
Learn how to better manage and optimize your sales process through data.
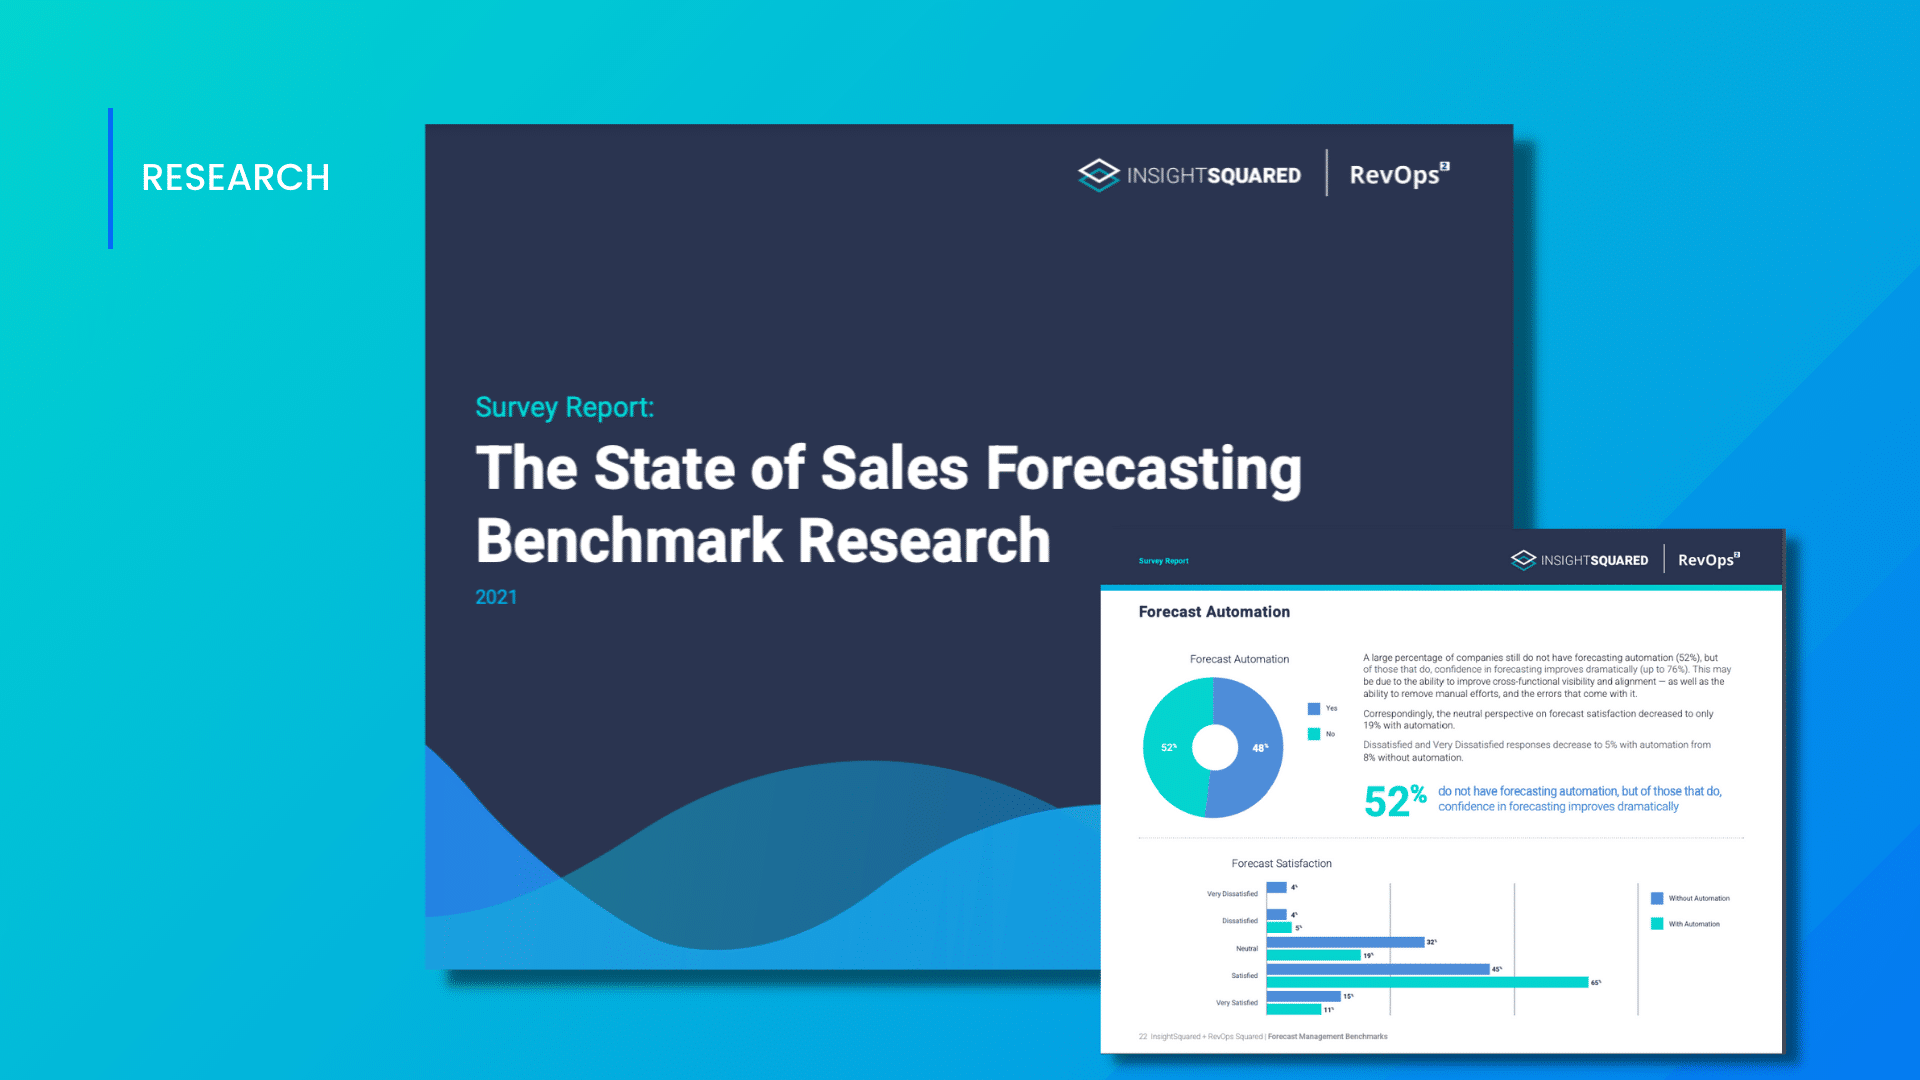
Research from InsightSquared and RevOps Squared Forecasting Benchmark data. See how your company measures up.
Ray Rike of RevOps Squared joins us to unveil the findings from the 2021 State of Sales Forecasting Benchmark Research.
See industry benchmarks on forecast accuracy, satisfaction, automation impact and more.
Lagging vs Leading? Do you have the metrics you need to accurately your forecast, inspect deals and assess pipeline health? Check out this on-demand webinar.
Do you feel confident in your team's sales forecasting abilities? Use this free guide to become a forecasting expert!
Measure what matters. Grab this free eBook highlighting 12 essential sales metrics B2B companies should be tracking to maximize execution.
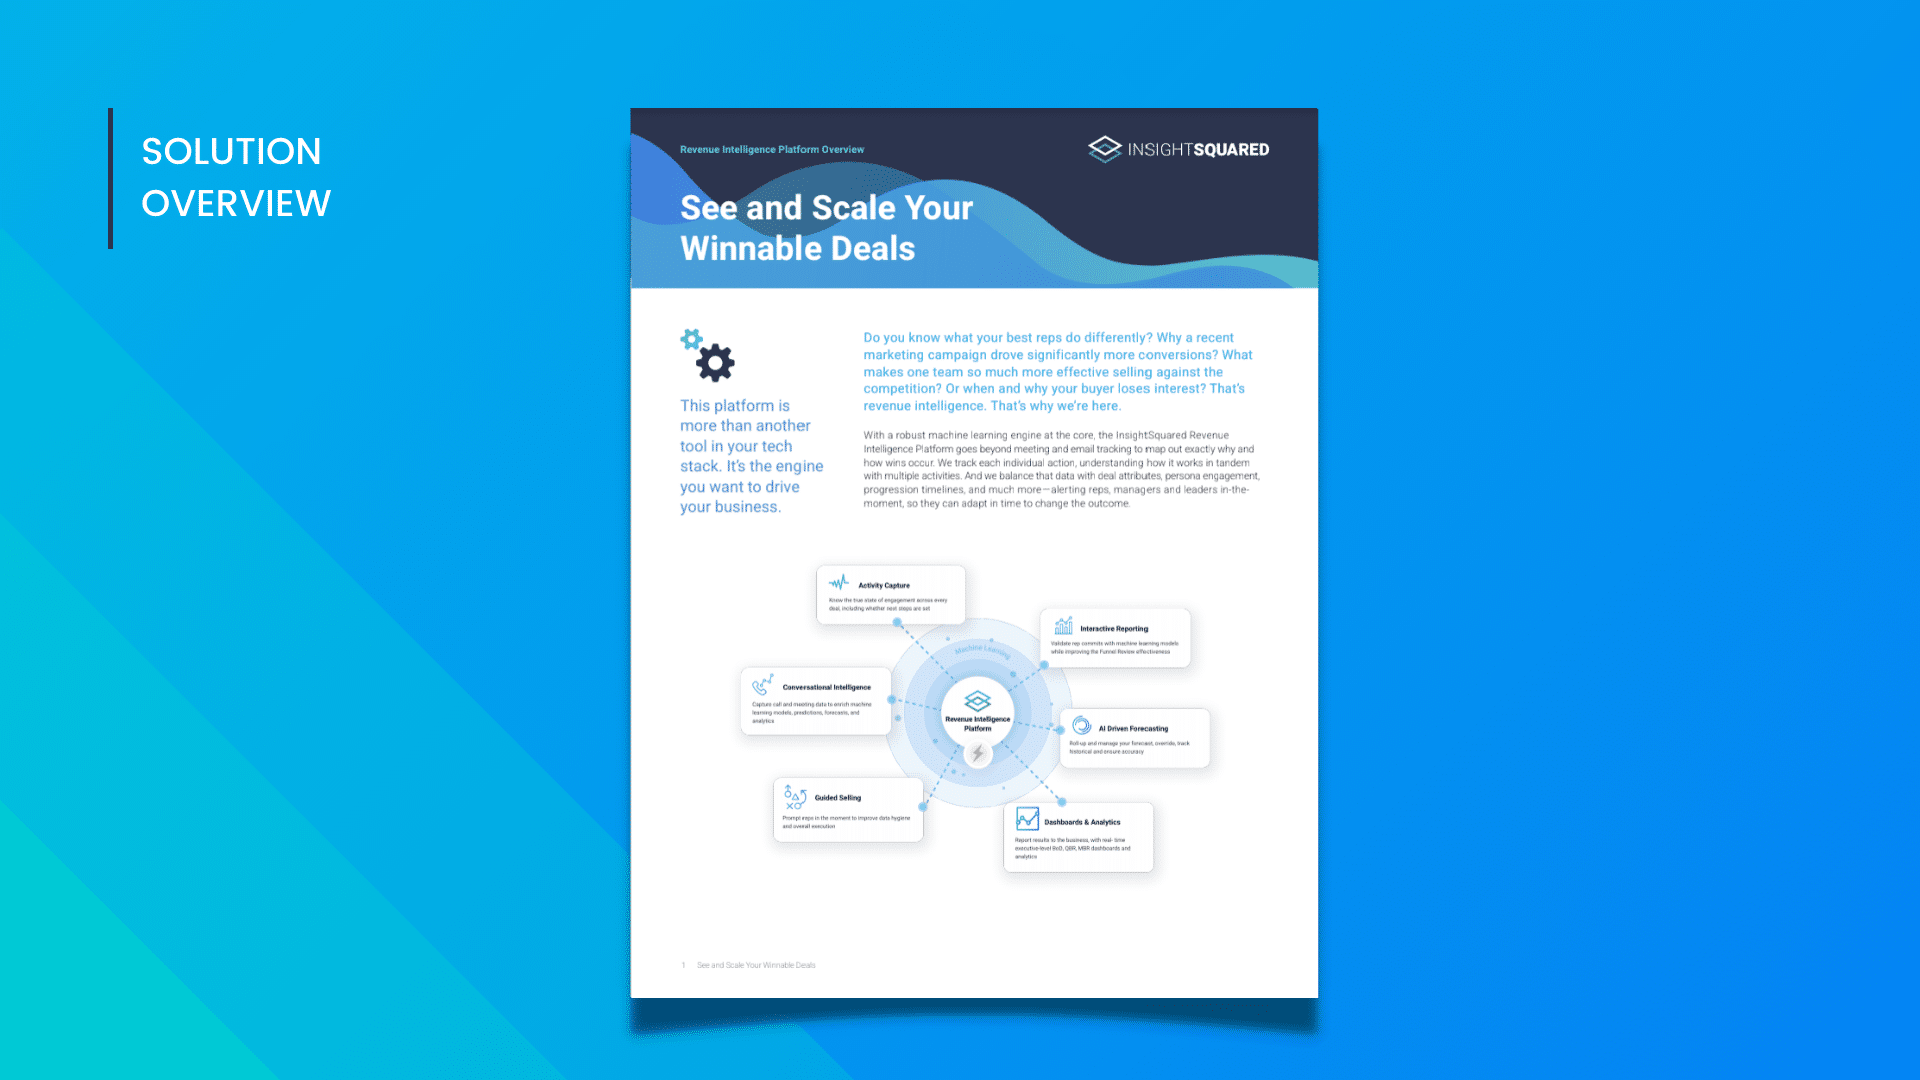
Check out all the value you can unlock within InsightSquared’s Revenue Intelligence Platform.
Look beyond traditional metrics to dig deep into the qualitative and quantitative milestones that separate wins from losses.
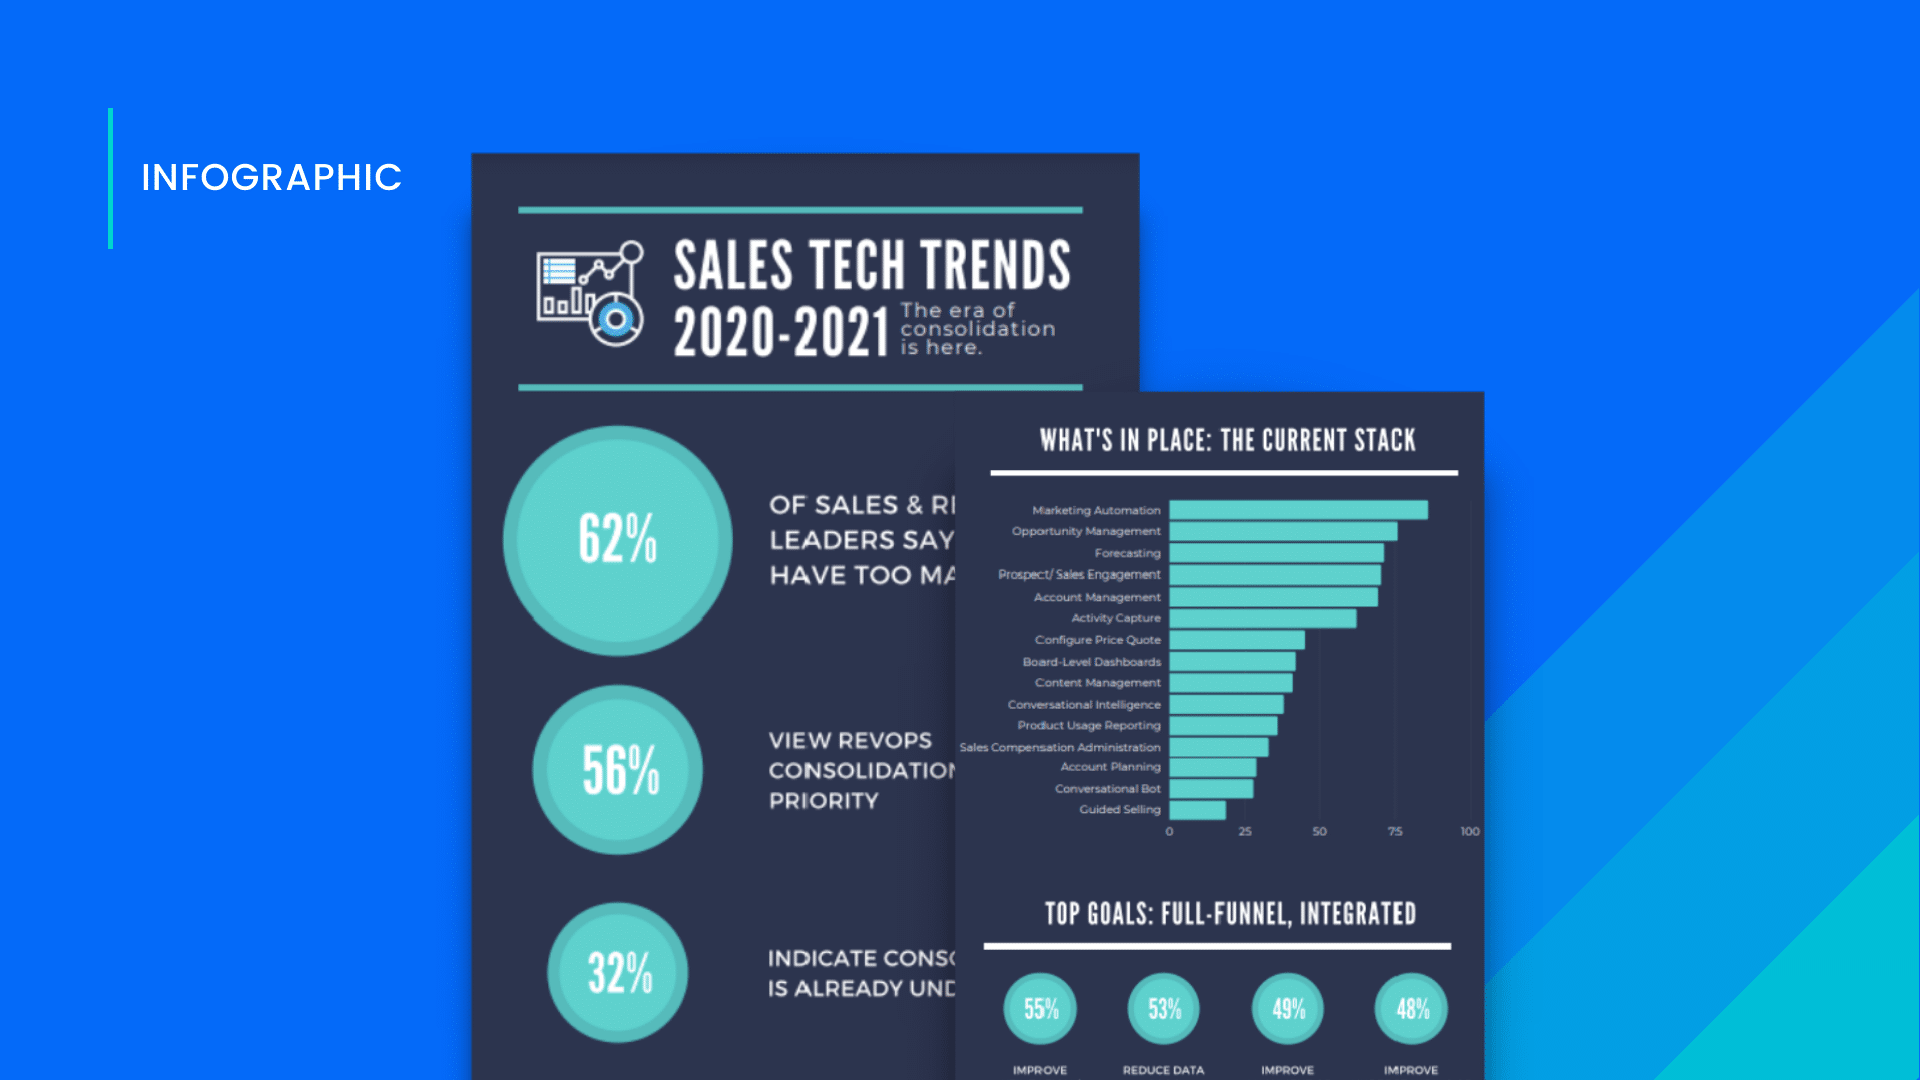
What do RevOps leaders think about sales tech consolidation? Download the infographic today.
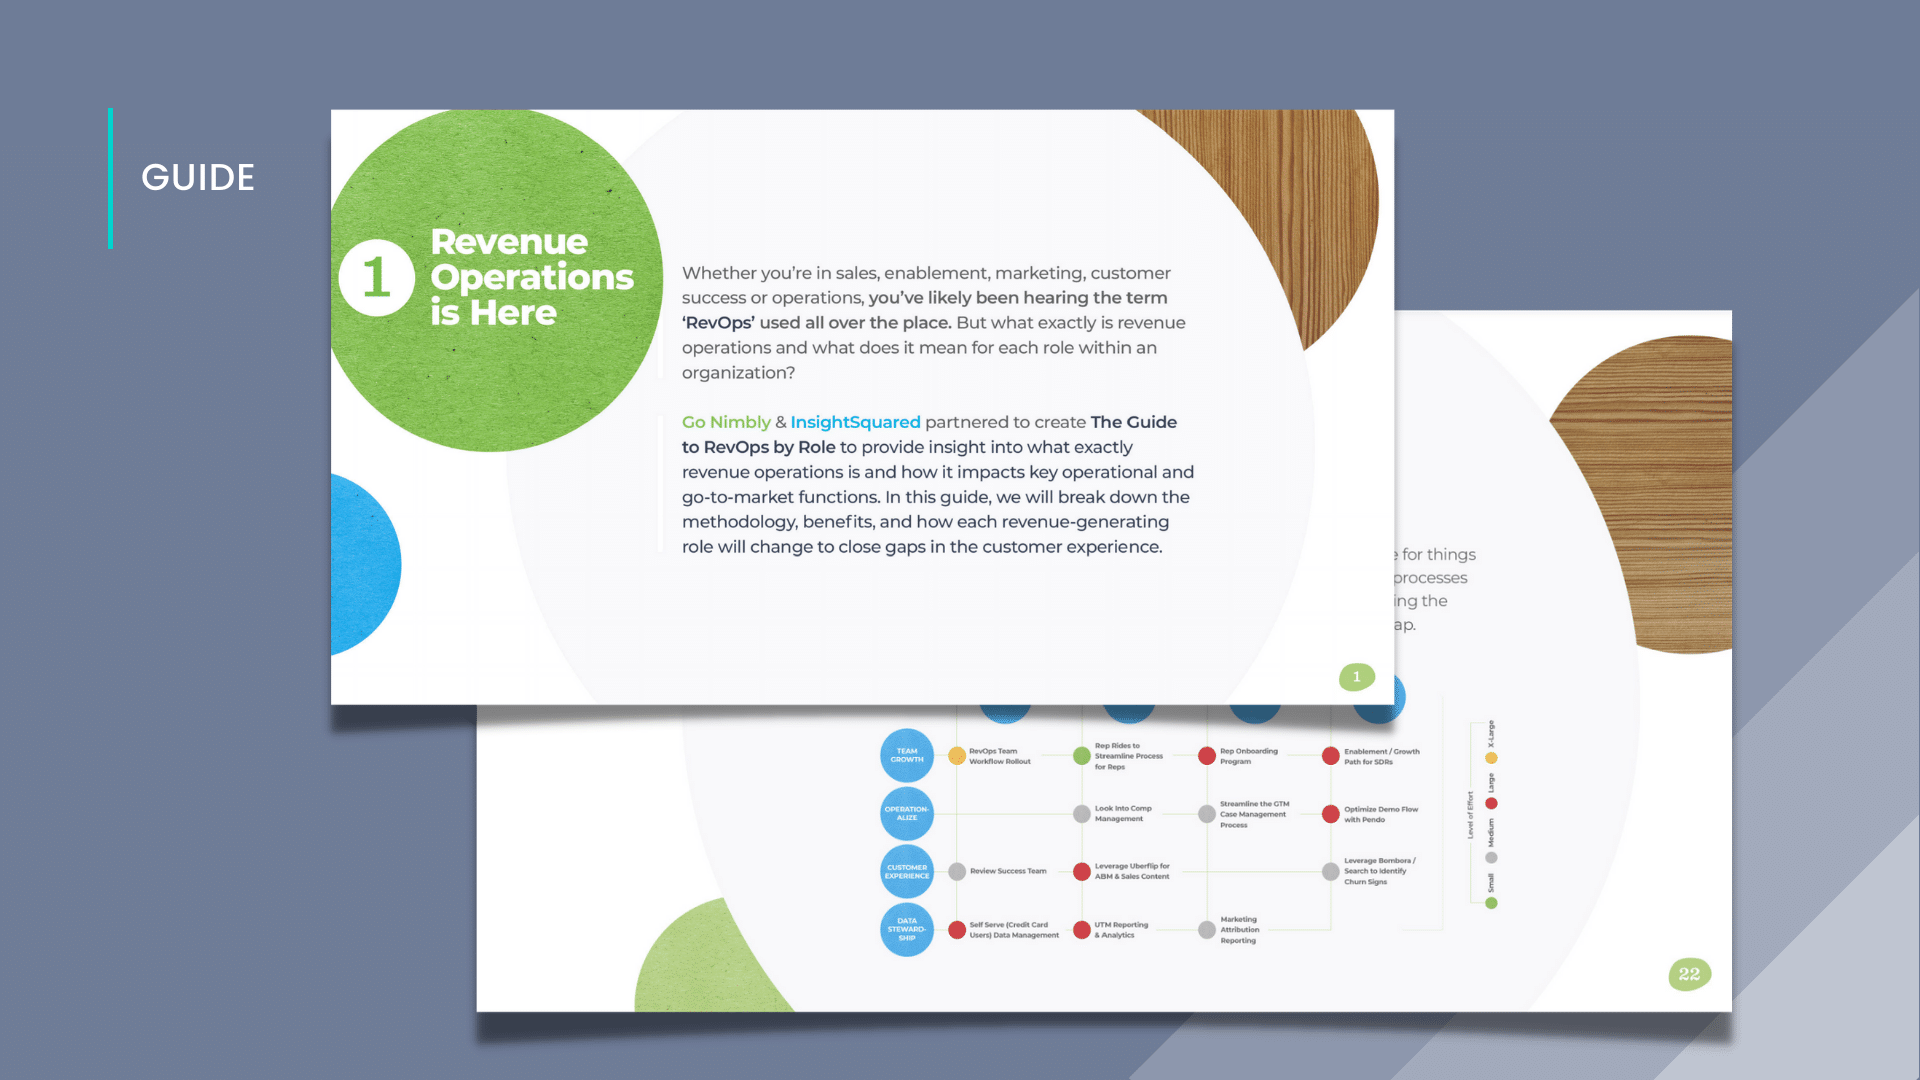
What exactly is revenue operations and what does it mean for each role within an organization?

Quick tips on how to evaluate the wide range of Activity Capture tools to get the depth and breadth of data you need.
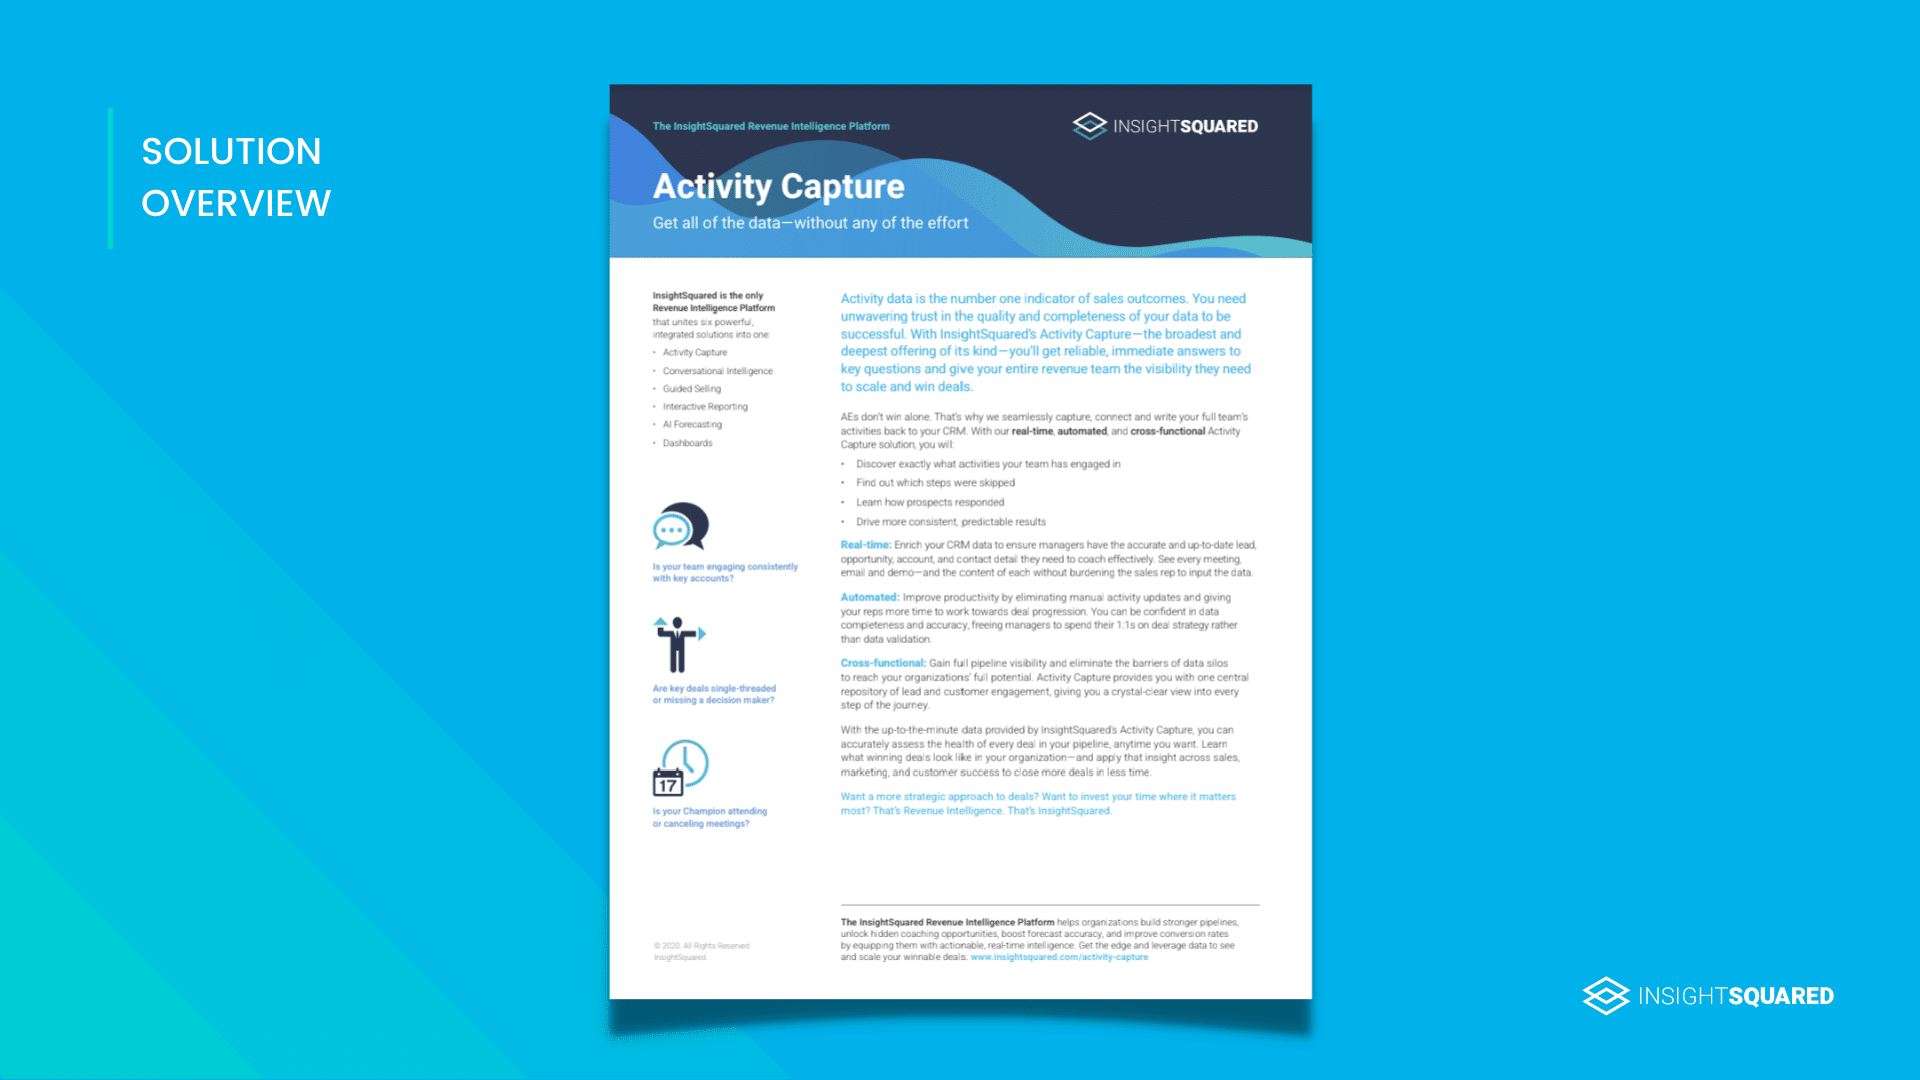
Is 100% of your data in your CRM? Without an automated process, its hard to be sure. Discover how Activity Capture solves the problem of missing data.
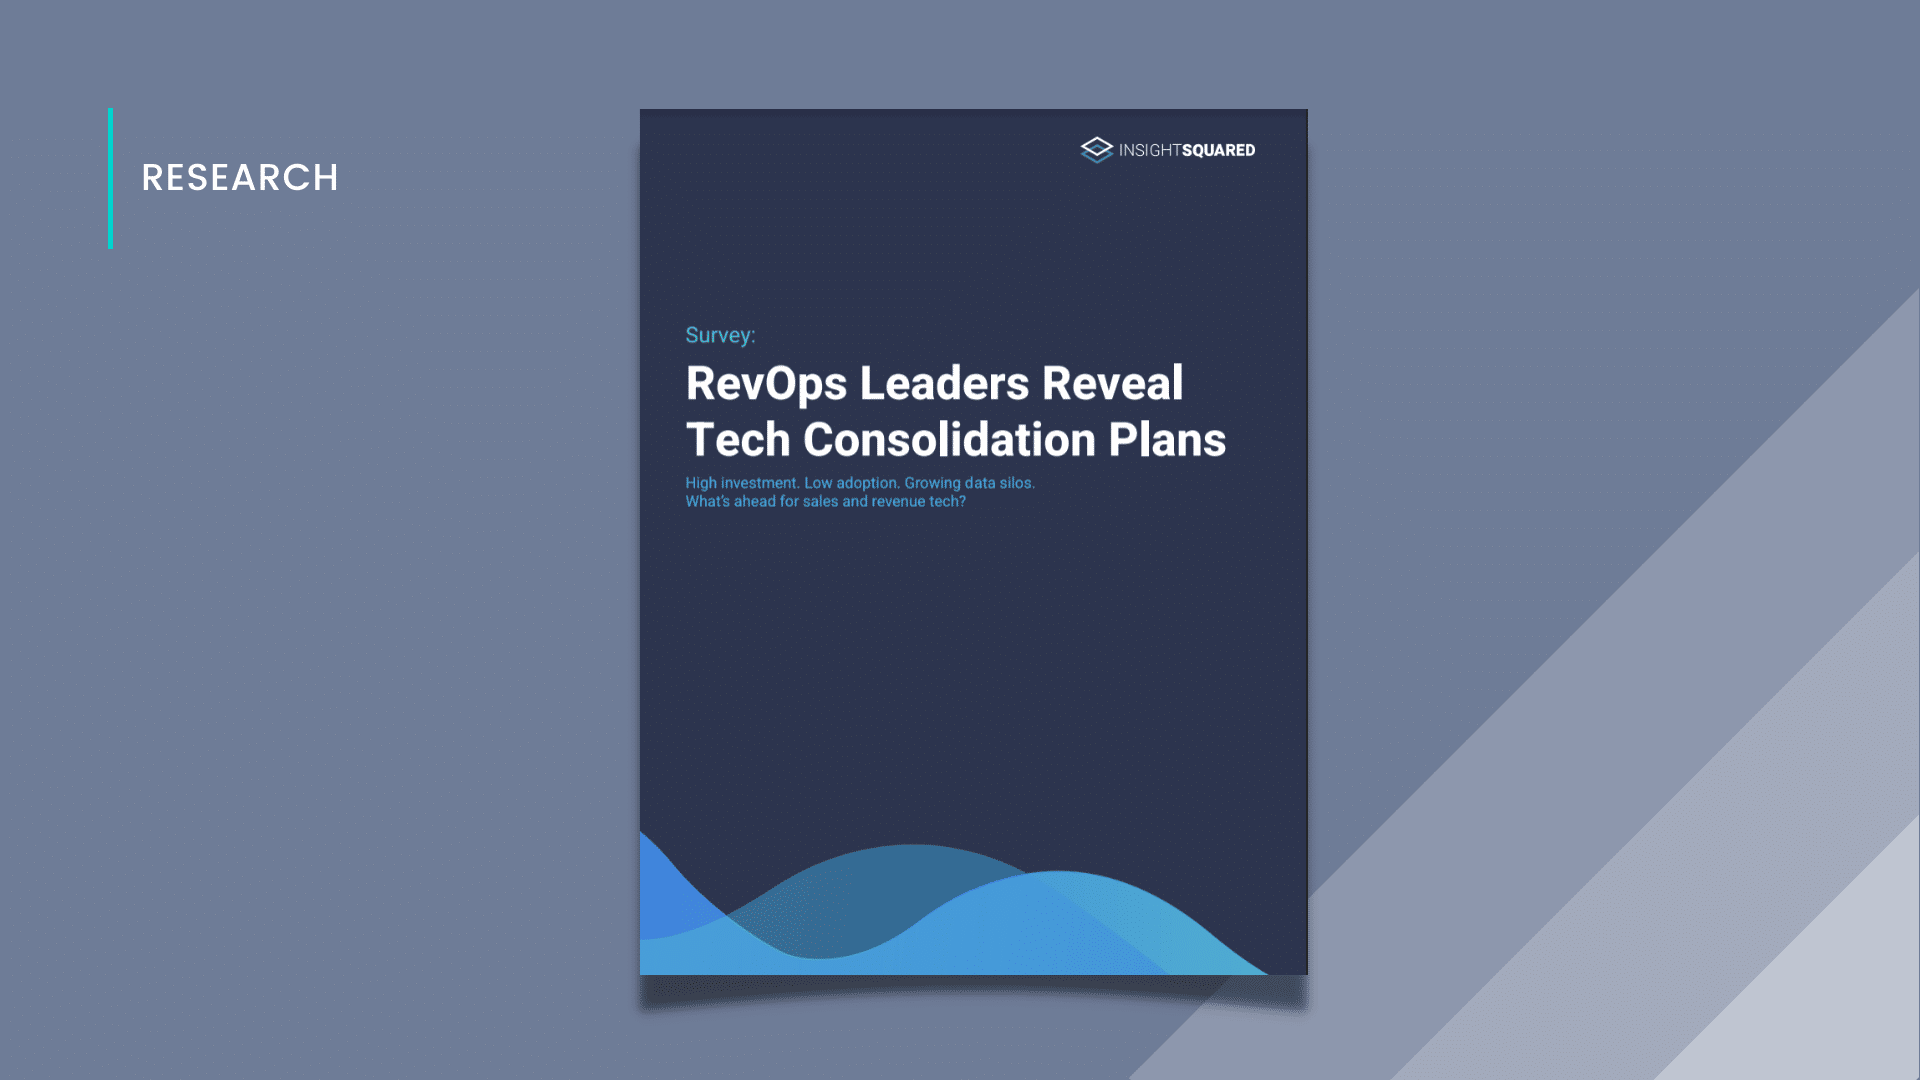
Get access to the results of InsightSquared’s fall 2020 survey of RevOps leaders on the topic of tech stack needs and trends.
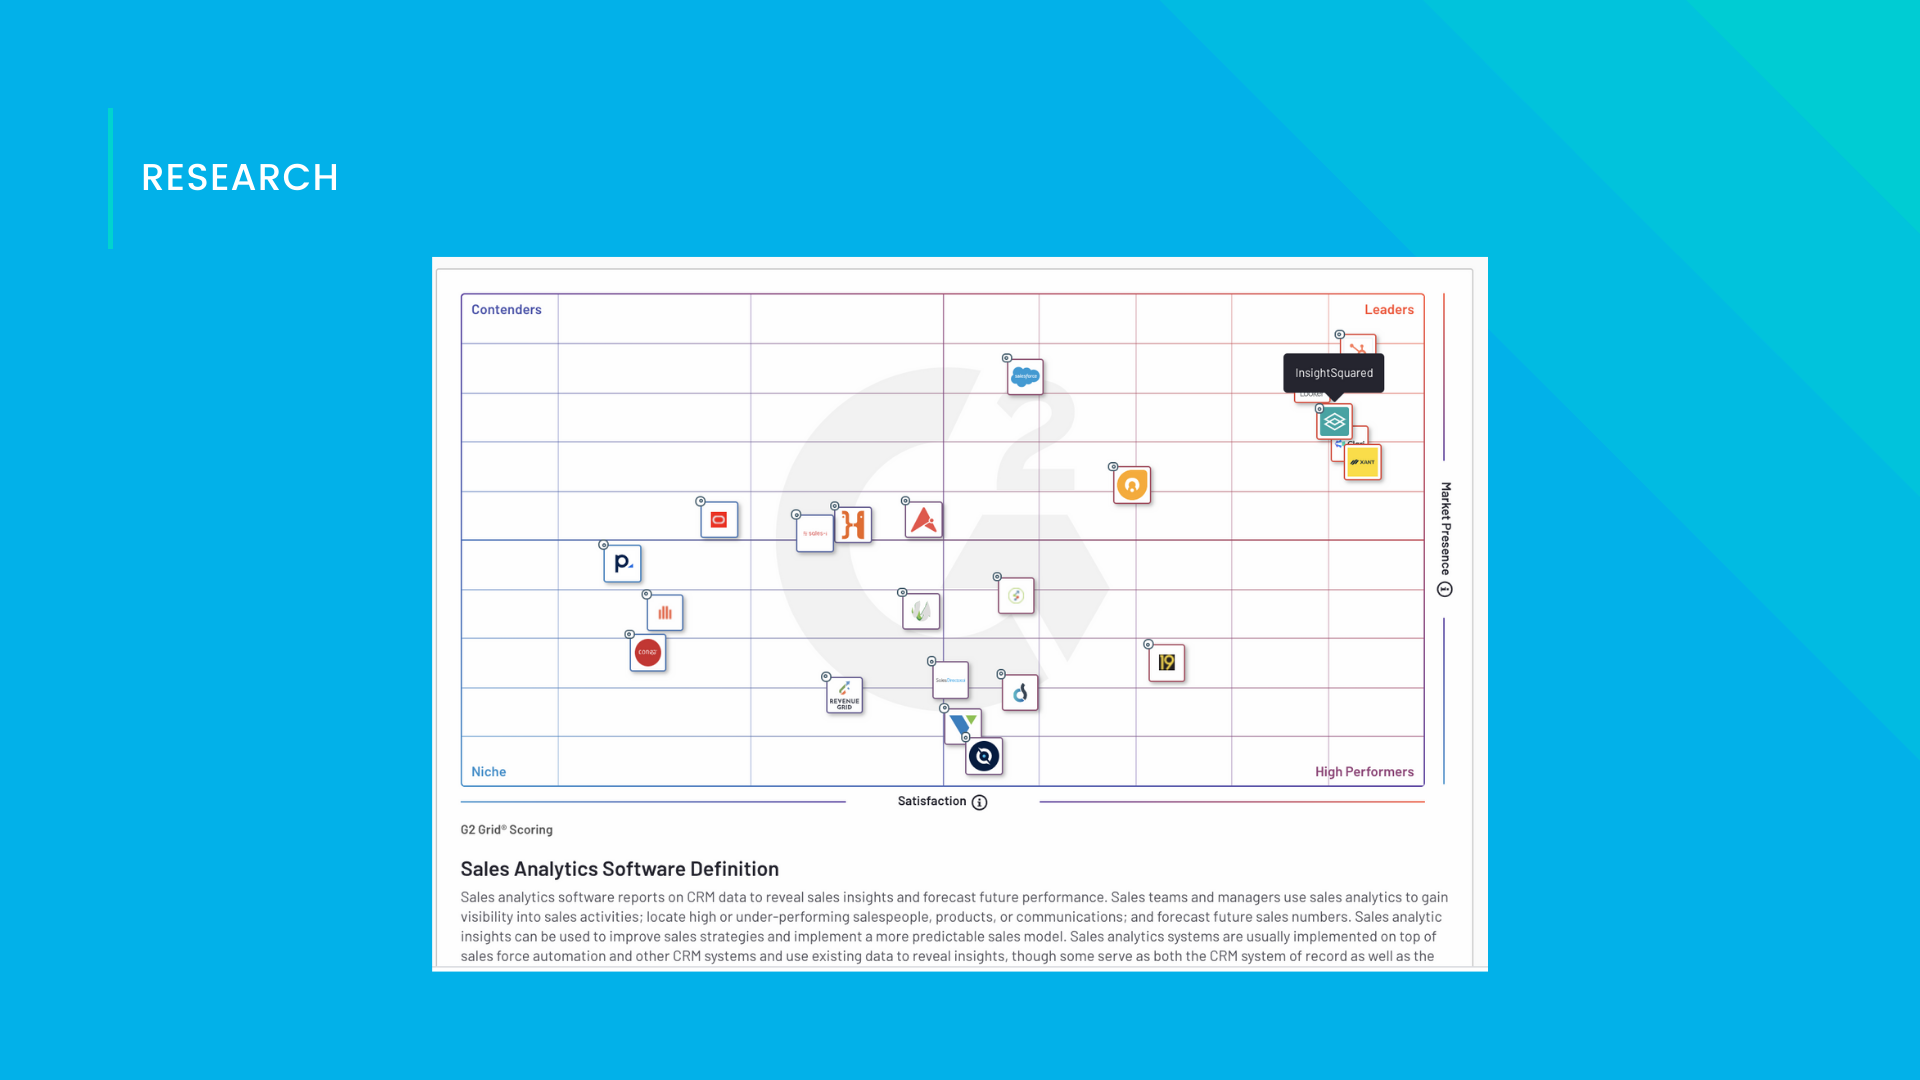
The winter 2022 G2 Grid Reports are here and InsightSquared is honored to be a leader. Check out the reports for more details.
Understand the signs that your sales stack might need a revamp and take the first step into consolidating with this guide.
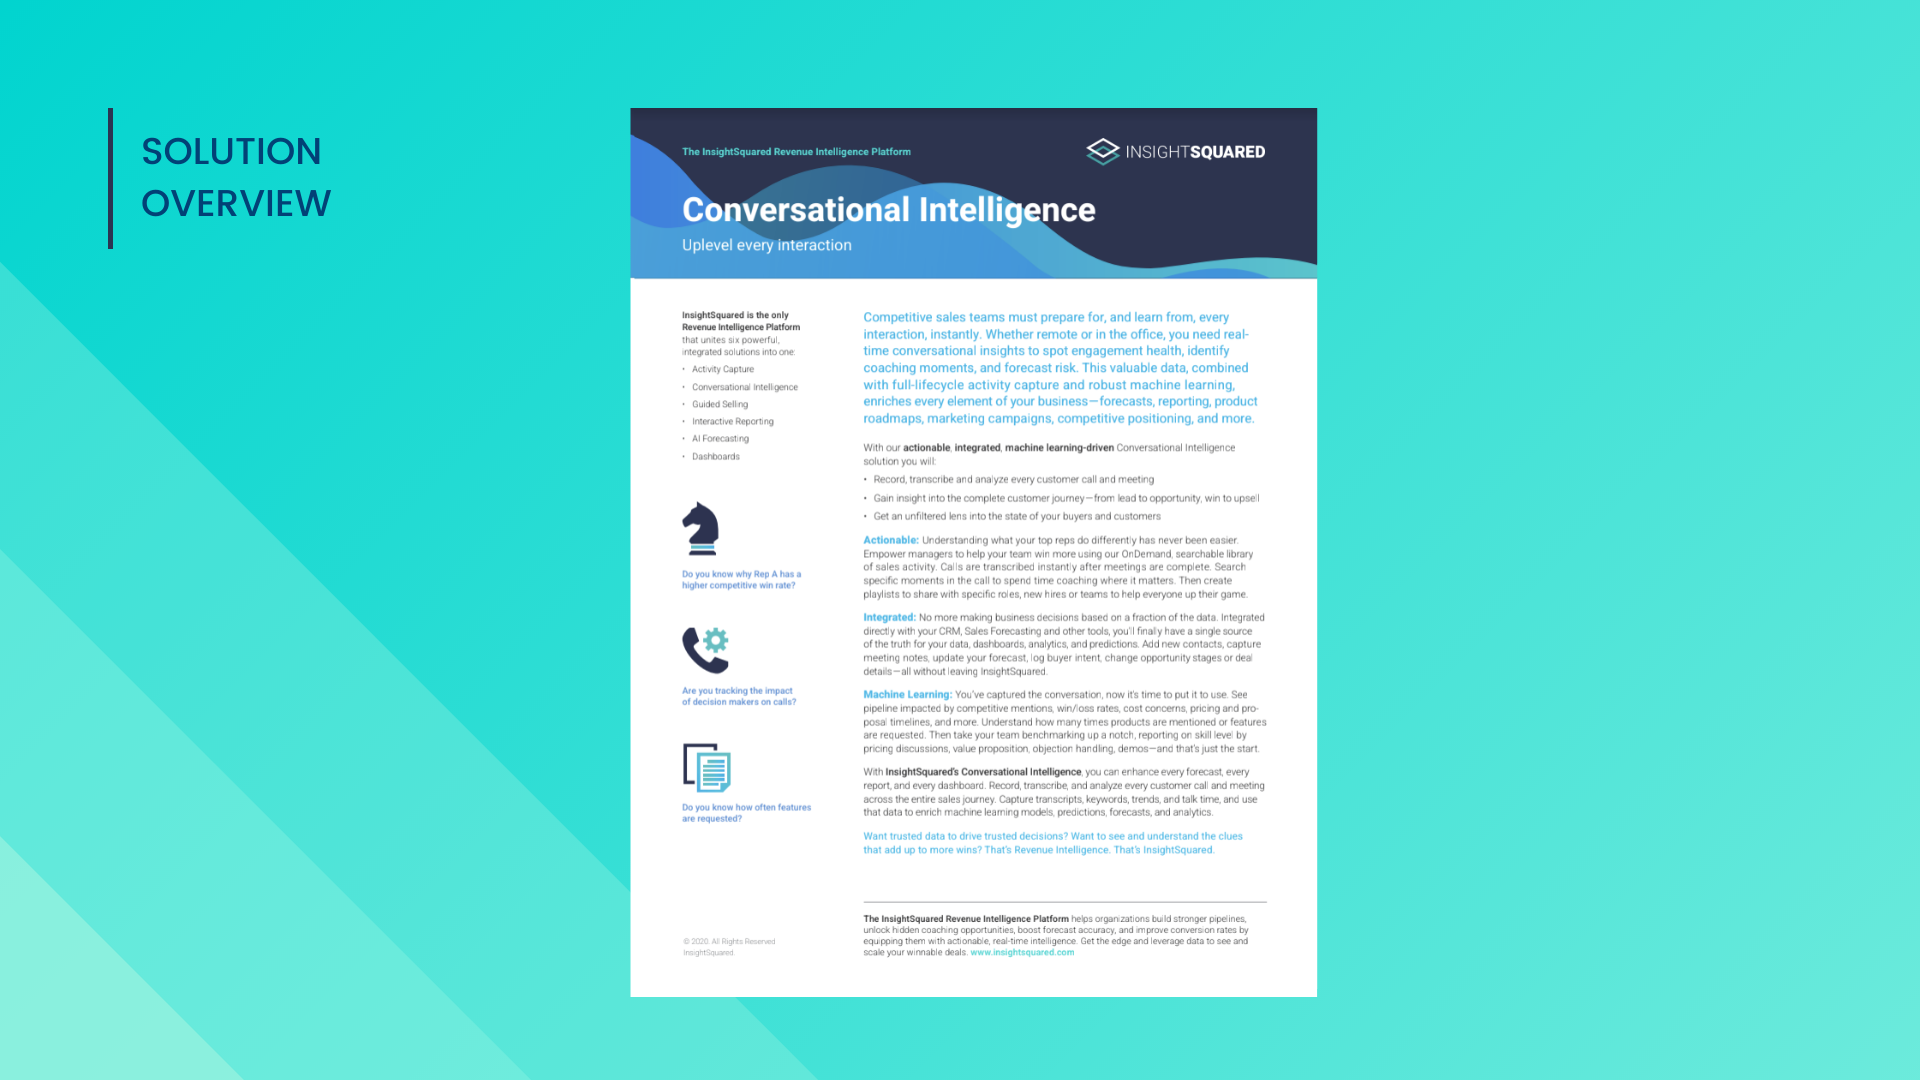
The intricacies of your calls and meetings are key deal datapoints. If you’re not capturing this info, you’re missing essential information. Conversation Intelligence bridges that gap.
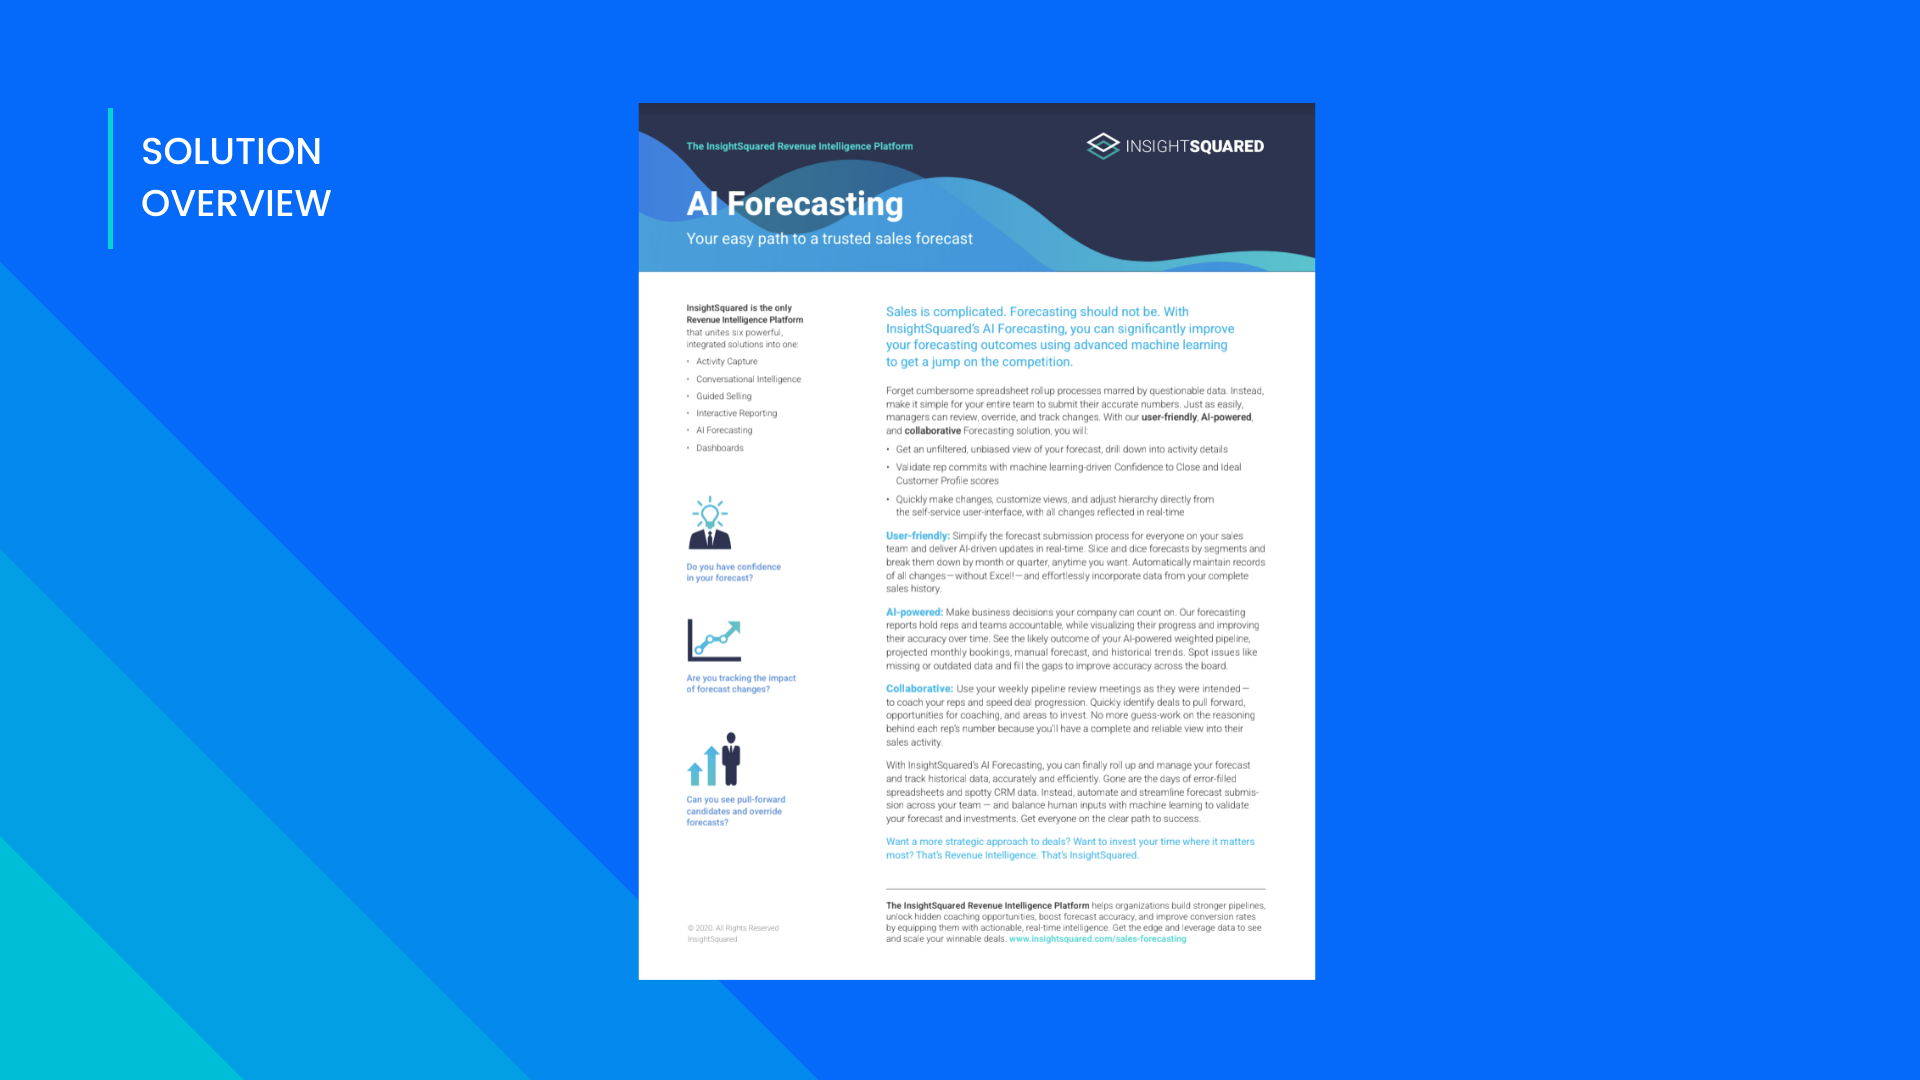
Nail your forecast every time with AI Forecasting. Start building an accurate forecast that you can trust.
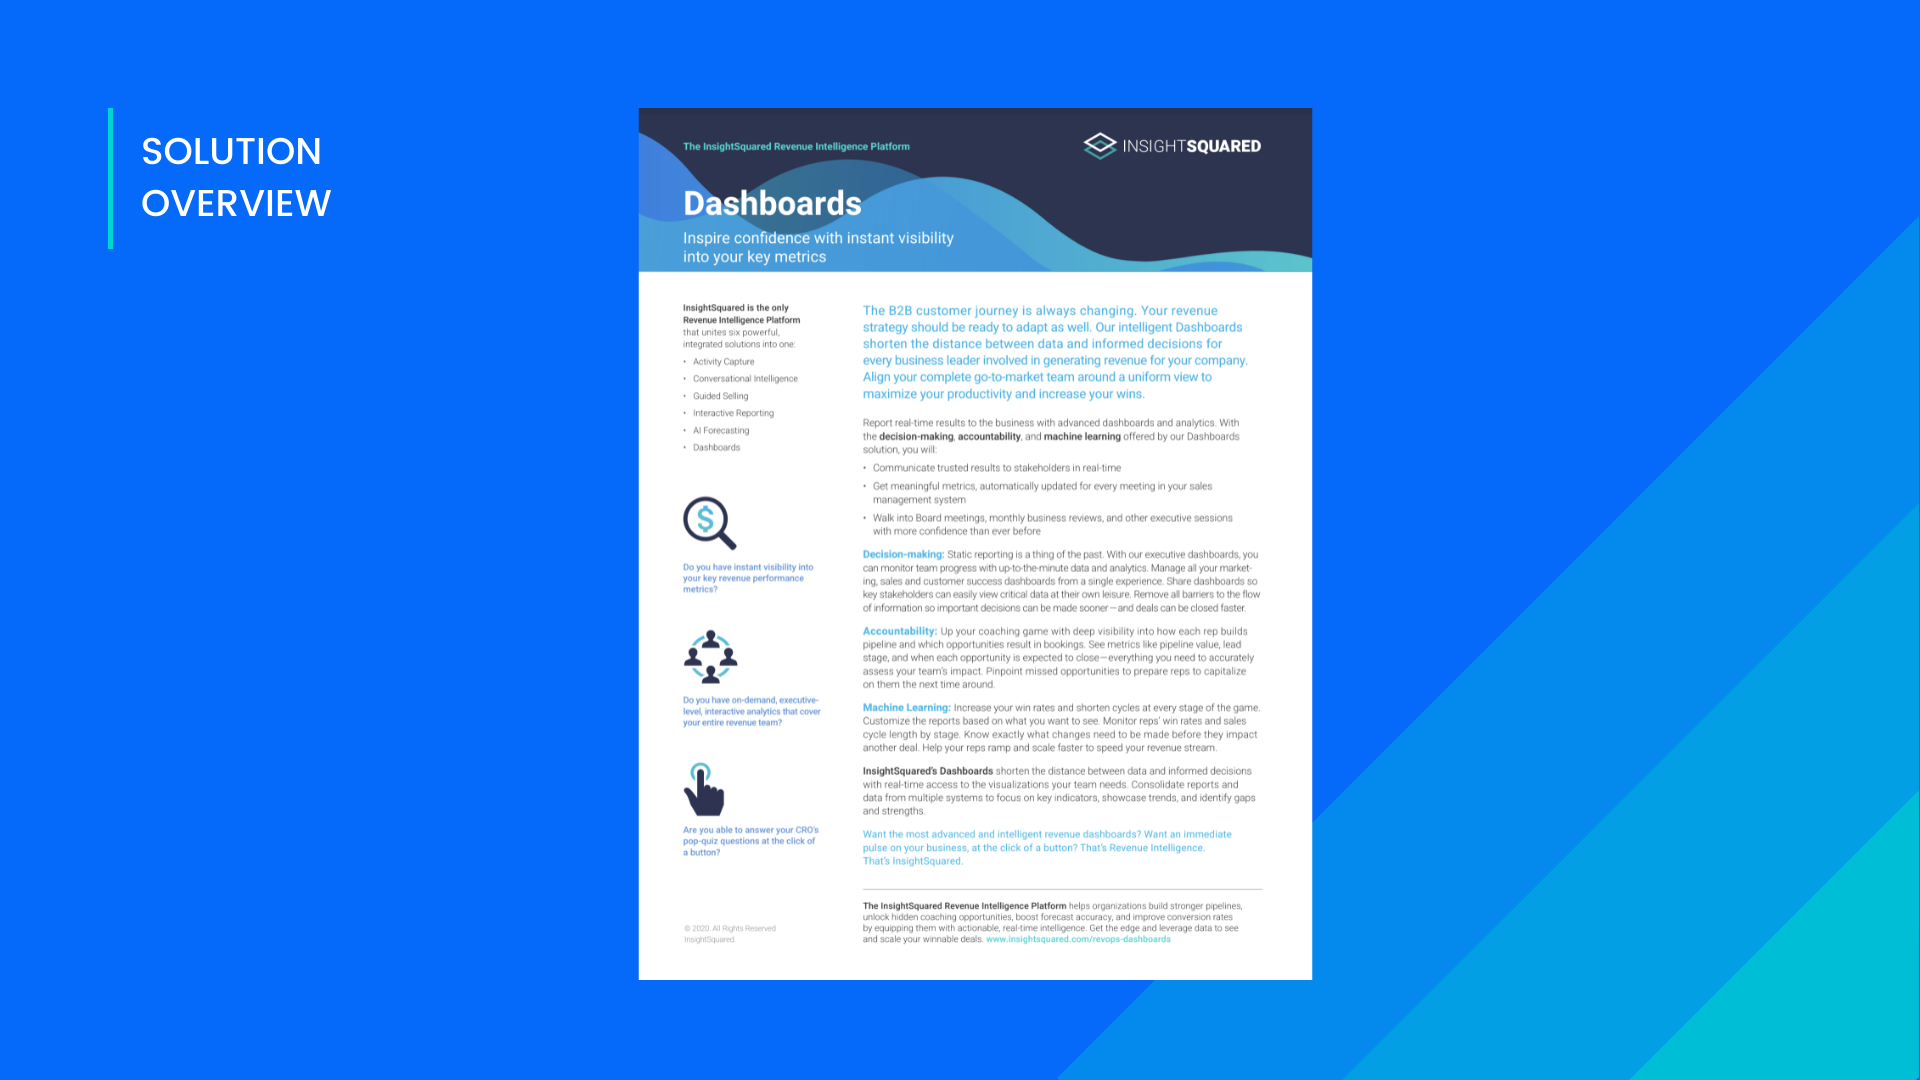
Ensure you have accessible, efficient, and actionable data with dashboards that are structured towards your goals.
Discover the crucial points in your sales cycle that can separate a winning deal from a losing deal.

Transform your pipeline reviews into proactive sessions with this guide.
Sick of being short on pipeline? Check this out to learn about the best practices and strategies for pipeline management.
InsightSquared partnered with OPEXEngine to track key SaaS sales metrics and survey peers to benchmark optimal performance.
Check out this session with Mediafly on 3 opportunities to accelerate your digital selling transformation in today’s changing landscape.

How to strike the perfect balance between managing direct reports and carrying a quota for those in the role of player-coach.
Know what your top reps do differently and learn how to replicate those strategies across your organization.
Say goodbye to the forecasting visibility gap and finally forecast with confidence using InsightSquared’s new forecasting solution.
Guest speaker Cinny Little, of Forrester, talks about best practices for leveraging revenue intelligence.
