Sales is the Growth Engine
Sales is the engine driving SaaS company value. Top and bottom line performance are totally dependent on the sales organization and its performance. And sales expense is typically the largest expense item on a growth SaaS company’s income statement. When scaling the business, sales typically averages roughly 30% of revenue, so therefore sales spend is one of the biggest investments a company can make.
For these reasons, accurately tracking key sales metrics and benchmarking your performance against peers and market leaders is critical to getting the most out of your sales resources.
Typical SaaS Sales Metrics
At the highest level, SaaS companies look at sales expense, headcount, sales productivity and SaaS metrics like:
- The cost of new customer acquisition (CAC)
- Customer lifetime value (CLV)
- Customer churn or retention rates
Underlying those metrics are processes which can improve or reduce performance in each of the above metrics. These processes are important to track accurately and benchmark to achieve the SaaS performance expected in the market. Here are some of the key results from the 2019 SaaS Sales Planning Benchmarks.
Customer and Net Dollar Retention Rates (%)

Quota Multiple
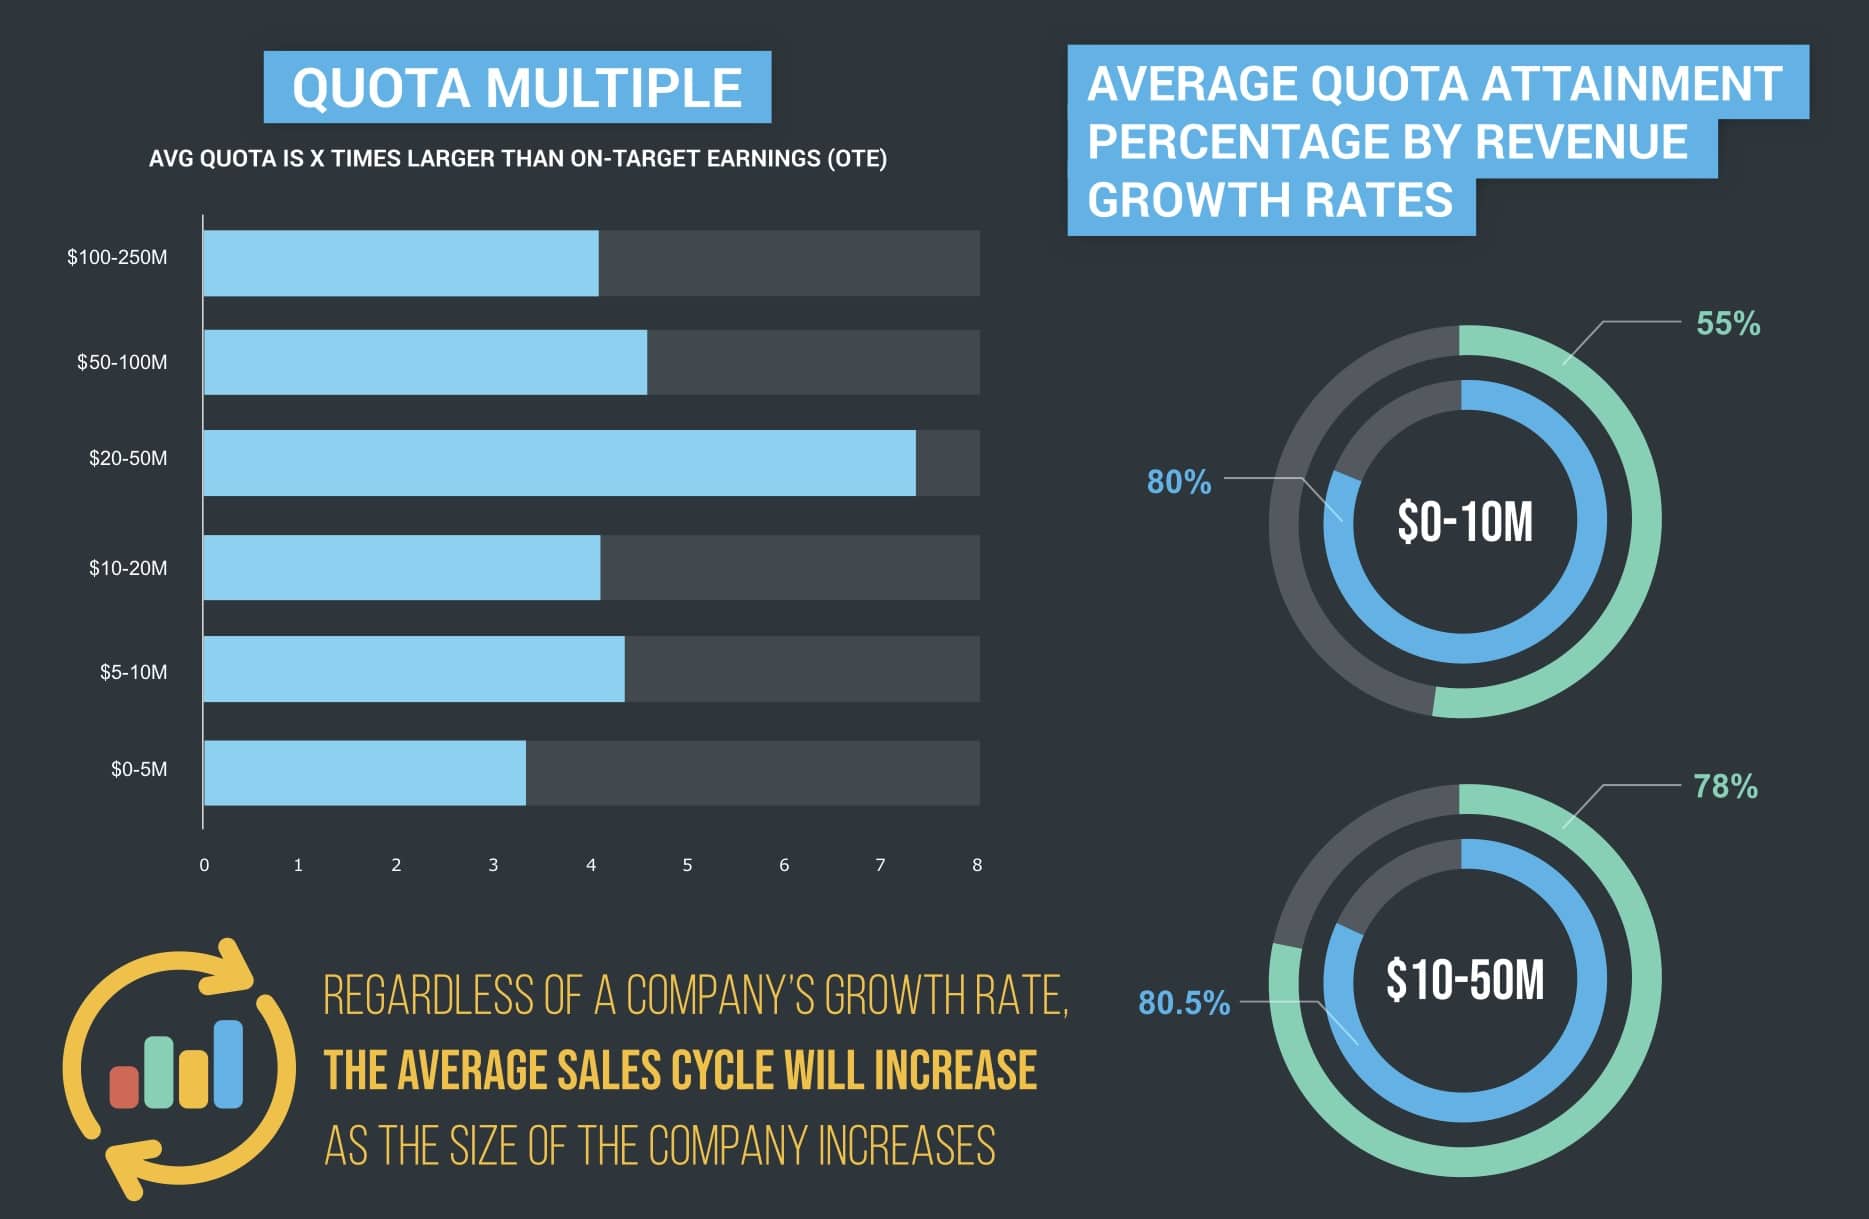
Source: OPEXEngine Sales Planning benchmarks 2019
One of the key metrics for SaaS businesses to track is the average length of sales cycles for your company’s products and services. Getting the systems right to accurately track and evaluate sales cycles is an important management function.
The Key Metric: Average Sales Cycle
SaaS companies that accurately and regularly track sales cycles tend to improve sales outcomes.
Shorter sales cycles equate to more sales and greater productivity from invested resources.
A wealth of information can be gleaned from automatically tracking your sales cycle. First and foremost, are you meeting or beating the benchmark for sales cycles from similar types of companies? How many of your individual sales reps meet or beat the benchmark? Are certain types of customers, or certain geographies and sales territories meeting or beating the benchmark, or underperforming? Answers to these questions can only be provided by accurate sales cycle tracking.
Defining the Start of the Sales Cycle
With most companies using a CRM, it should be easy to calculate the length of time between getting a lead and when it is a closed sale. But, like almost everything with metrics, the devil is in the definitions. To calculate sales cycles, you need a starting date. At what point does the sales cycle start?
Some companies consider the start of the sales cycle when a lead is entered into the CRM. However, many companies purchase lead lists which can sit untouched for long periods of time so that can be a troublesome start date because nothing has really happened. Companies may have several resources working leads to qualify them and the point of qualification can be unclear so the initial working of a lead is also problematic. A salesperson may send many emails to a prospect, the prospect may respond but the lead isn’t yet an opportunity.
Typically, every sales organization has some point where they register a lead as an opportunity and that is the point when we recommend that a company start tracking sales cycles. That doesn’t mean that a company shouldn’t analyze and track how long leads sit until being classified as an opportunity, but we recommend starting the sales cycle from the date when a lead is qualified as an opportunity.
Average sales cycles typically vary among SaaS companies based on several factors:
- Company size: Larger companies usually have longer sales cycles than smaller companies
- Contract value: Companies selling subscriptions with larger average contract values also have longer sales cycles than companies selling low priced, low touch subscriptions
Across the board, though, when comparing peer companies with similar sales models and at similar stages of growth, there is a strong correlation between growth and sales cycles.
Faster growth companies have shorter sales cycles and slower growth companies have longer sales cycles when comparing similar companies.

Using data from our recent OPEXEngine 2019 B2B SaaS Sales Planning Survey conducted in March and April 2019, with over 90 SaaS B-2-B vendors participating, we found on average, for companies with 30%+ revenue growth, that median sales cycles were 11-13% higher than for comparable companies with revenue growth below 30%. For the highest revenue growth companies over 50%, the difference in sales cycles can be up to 25% faster than with similar sized companies selling comparable average contract values.
The data for growth companies in the $10M-$50M range showed a lot of variances which we’ve seen before. Companies in this stage are typically adding salespeople at a fast rate. The average sales cycle can be extended because the data includes new hires and new territories as well as established sales resources. While the median sales cycle days for this group is 135, the best-performing companies have a sales cycle of 65 days or less in this group. Sales cycle consistency throughout the sales organization is also an important metric to track.
Total Median Sales Expense by ARR
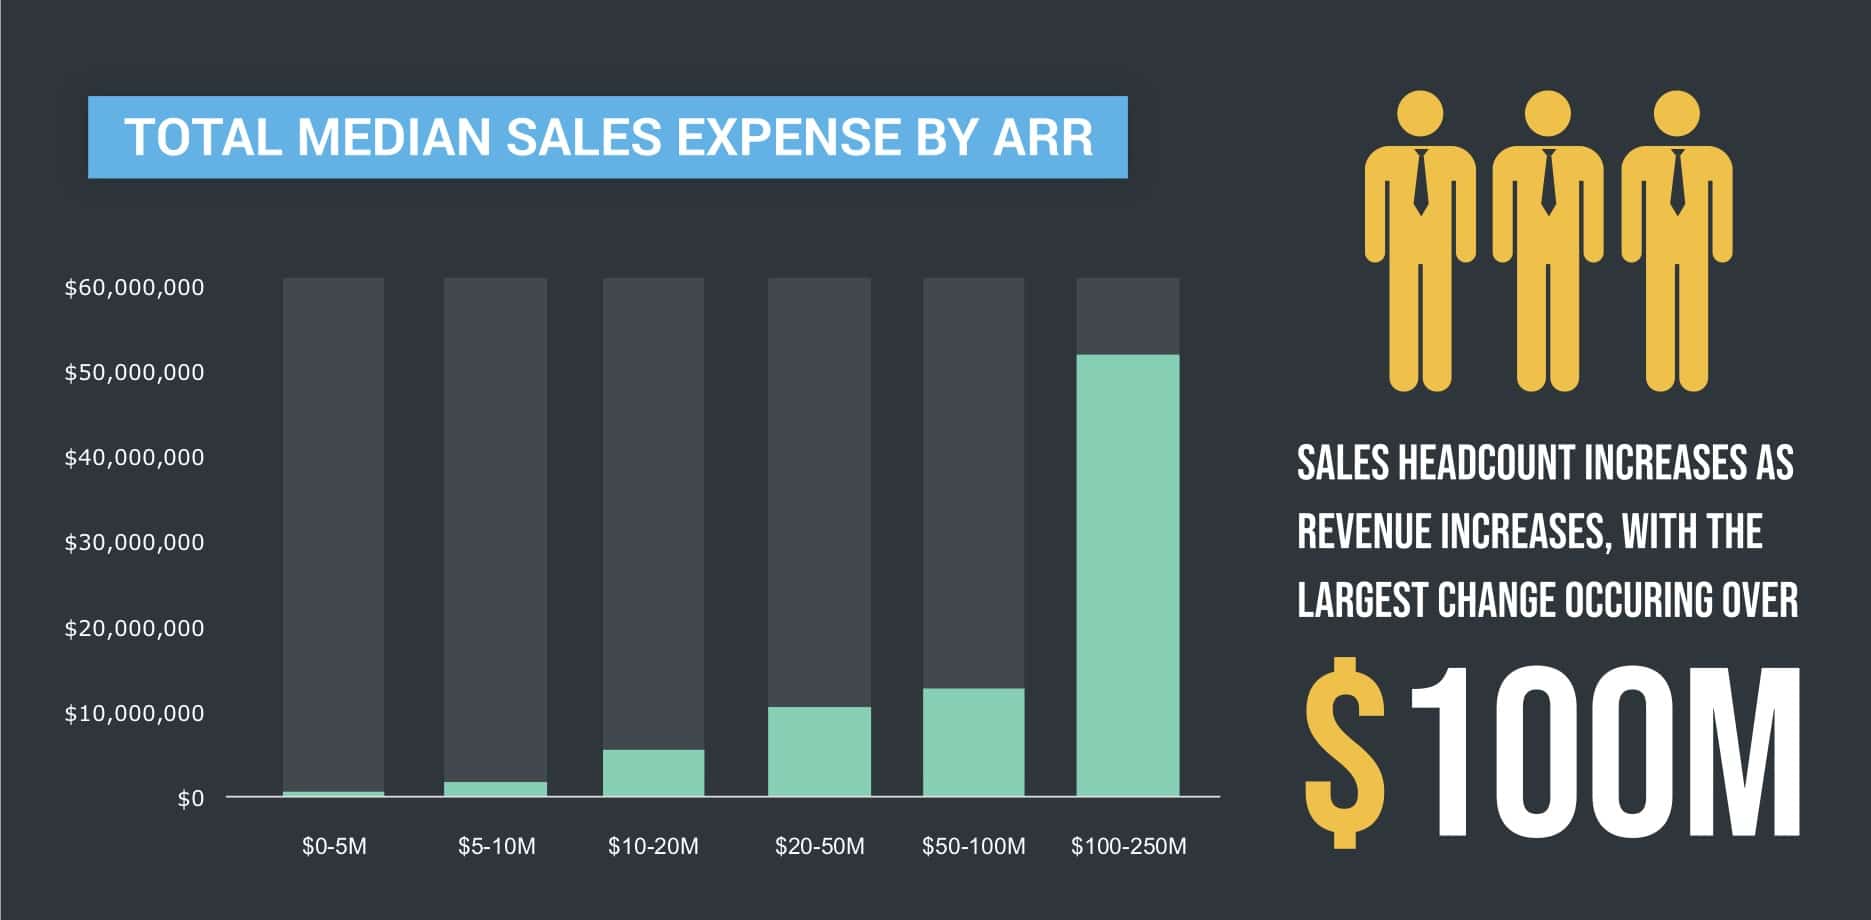
Source: OPEXEngine Sales Planning benchmarks 2019
Data-Driven Management
Focusing on sales cycles is a great way to get the entire management team on board with improving sales productivity. You can argue about the best sales process, the most effective sales compensation plans, and territory management, but you can’t argue with concrete data on sales cycles, the benchmarks for sales cycles from peer companies, or the fact that shorter sales cycles are consistent with faster growth.
Interested to learn more on SaaS sales planning? Listen to our webinar on SaaS sales planning benchmarks. To learn more about SaaS sales benchmarks from OPEXEnginge, a confidential SaaS benchmarking platform and Finance community, reach out at info@opexengine.com.
