RevOps Dashboards
On-demand, executive-level, interactive analytics covering your entire revenue team.
Communicate trusted results to stakeholders in real-time.
Get meaningful metrics, automatically updated for every meeting in your sales management system.
Walk into Board meetings, monthly business reviews and other executive sessions more confident than ever before. Our intelligent RevOps dashboards shorten the distance between data and informed decisions by providing real-time access to the visualizations your team needs. Consolidate reports and data from multiple systems to focus on key indicators, showcase trends, identify gaps and strengths. Get an immediate pulse on your business with the click of a button.
DECISION-MAKING
![]()
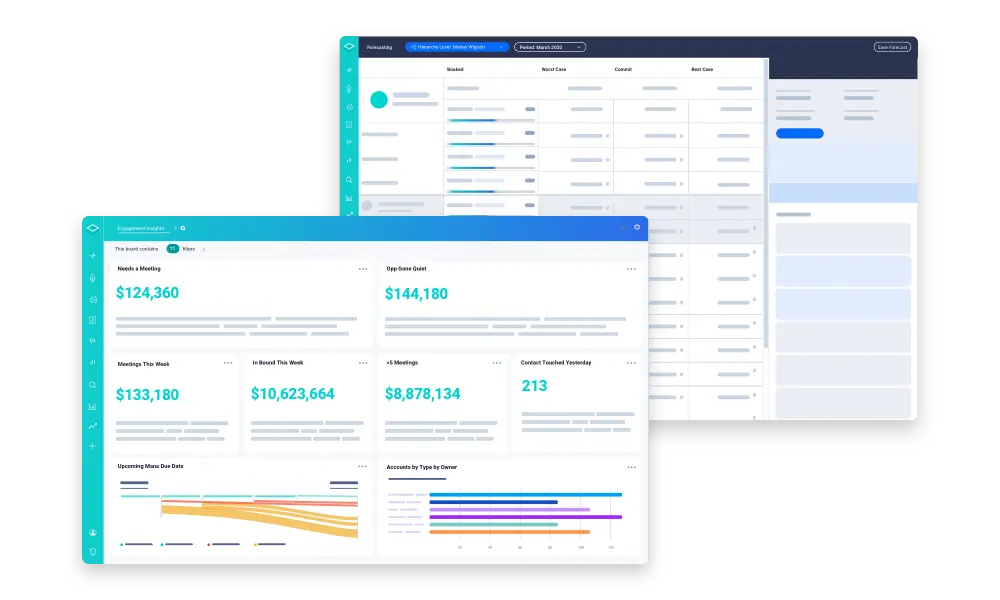
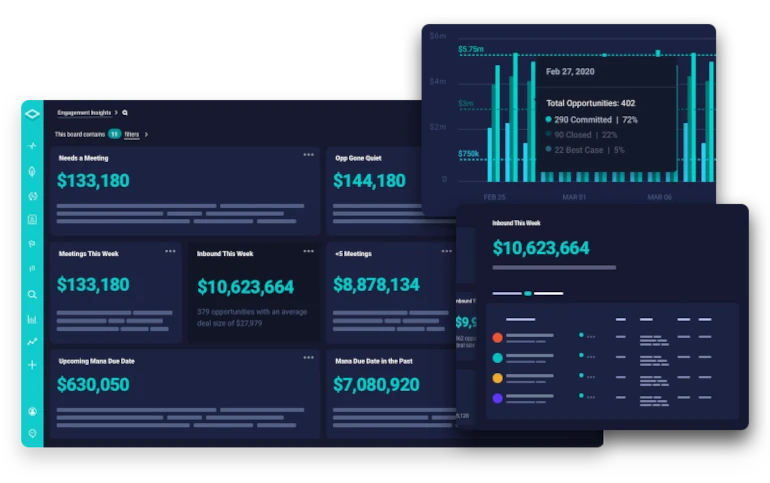
Monitor Performance in Real Time
Static reporting is a thing of the past. With our executive dashboards, you can monitor team progress with up-to-the-minute data and analytics. We start at a high level with your core metrics and KPIs, then give you the freedom to drill down to activity-level granularity.
Manage all your Marketing, Sales and Customer Success dashboards from a single experience. Share dashboards so key stakeholders can easily view critical data at their own leisure. There are no longer barriers to the flow of information, meaning important decisions can be made sooner and deals can be closed faster.
ACCOUNTABILITY
![]()
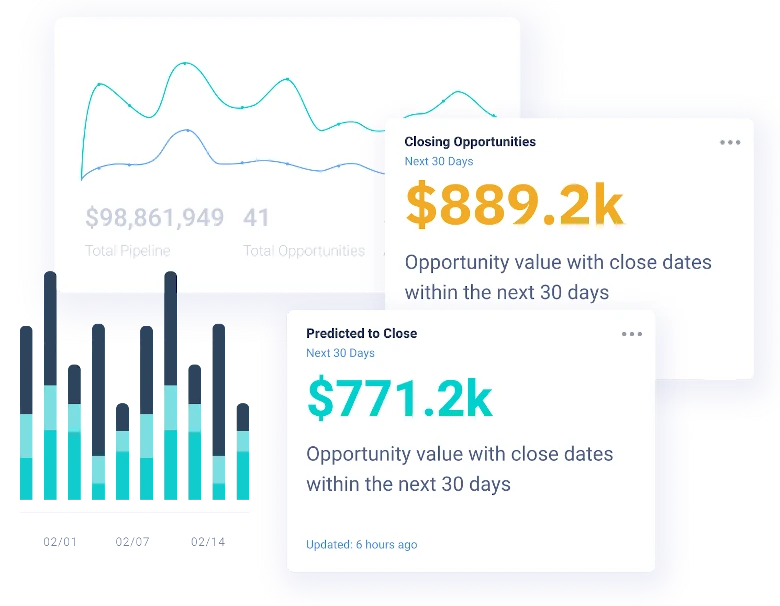
Connect Activities to Pipeline, Bookings, Retention and Upsells
Pipeline and Booking Contribution reports show you how effectively each rep builds pipeline and whether opportunities result in bookings. View metrics like pipeline value, lead stage, and when each opportunity is expected to close — everything you need to accurately assess your team’s impact.
You can filter reports by team or rep to gauge their impact on a more granular level. The deeper you can pinpoint missed opportunities, the better you can prepare reps to capitalize on them the next time around. That’s the true sign of a good coach.
MACHINE LEARNING
![]()
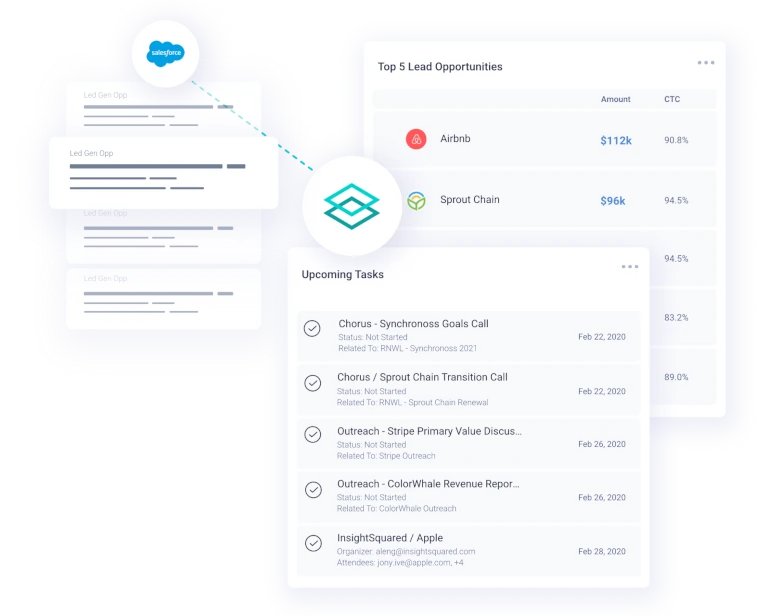
Increase Win Rates and Shorten Cycles at Every Stage
Every stage of the sales cycle presents new challenges. Customize the reports based on what you want to see. Monitor reps’ win rates and sales cycle length by stage. Leverage the best practices displayed by top performers to quickly elevate rep performance in both key metrics.
For you to manage rep efficiency and effectiveness in real time, you need to review the data in real time. Know exactly what changes need to be made before they impact another deal. Not only will your reps grow faster, but so will your revenue stream.
See Revenue Intelligence in action.
Schedule a demo of our 6 in 1 platform today!
