InsightSquared: Powerful Sales Forecasting & Analytics
No code. Self-service. With 350+ out-of-the-box reports, InsightSquared is your fast path to predictable revenue growth.


![]()
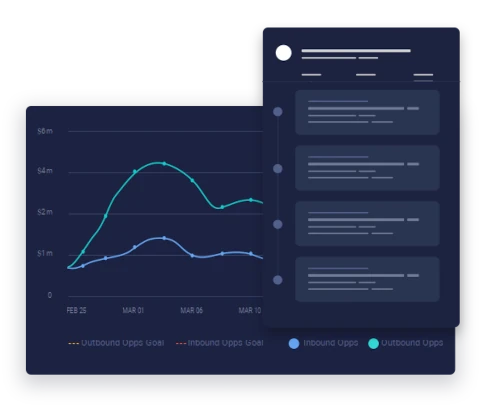
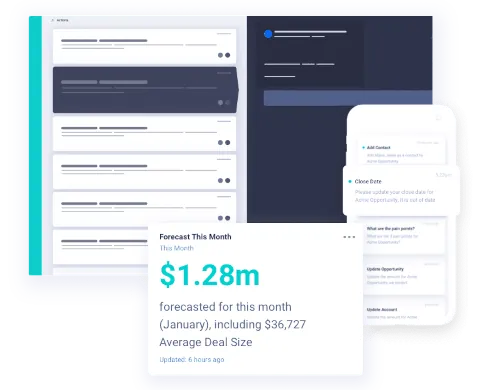
AI Sales Forecasting
Know your number and exactly what it takes to get there.
Say goodbye to error-filled spreadsheets and spotty CRM data. Automate and streamline forecast submission across your team. Then balance human inputs with machine learning to validate your forecast and investments. Know how to minimize risk and capture upside—to not just meet, but exceed your goal.
![]()
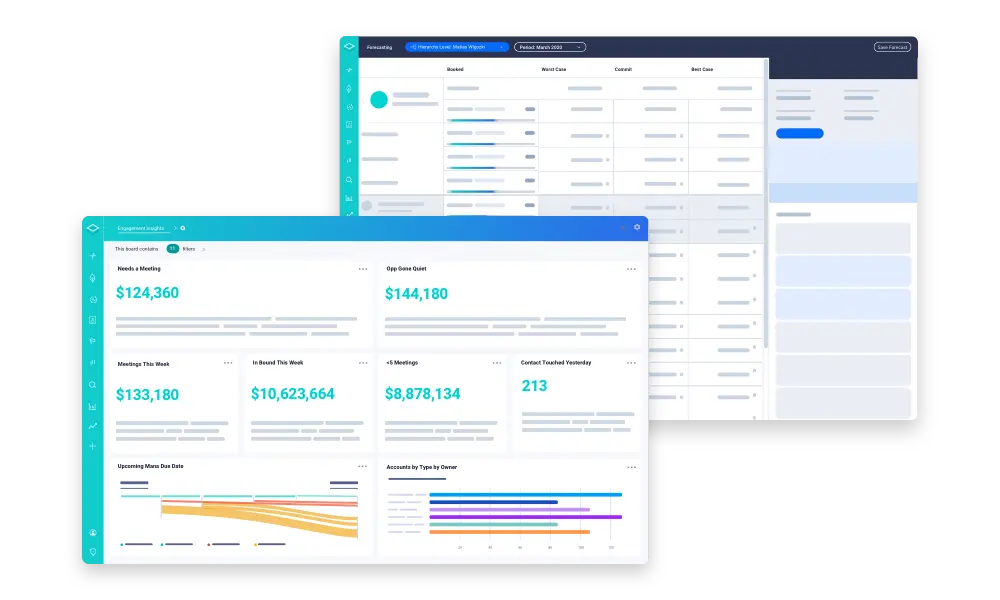
InsightSquared Revenue Analytics & Dashboards
Ensure detailed, automatically updated views for the meetings in your sales management system.
The B2B customer journey is always changing, which means your revenue strategy should be ready to adapt as well. Our intelligent RevOps dashboards shorten the distance between data and informed decisions for every business leader involved in generating revenue for your company. Align your complete go-to-market team around a uniform view to maximize results.
![]()
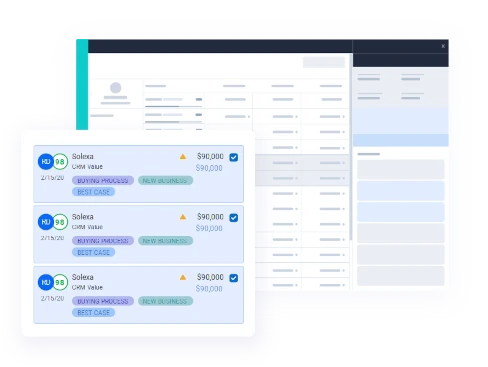
Interactive Pipeline Management
InsightSquared helps teams identify forecast risks and opportunities for upside in time to change results.
Go beyond 1:1s, funnel progression and goal mapping to assess the entire customer journey utilizing our Machine Learning Confidence-to-Close and Ideal Customer Profile models. Understand key activities, processes, behavior and likely results. Instantly detect changes, exceptions and risk. Know if you are invested in the right deals. Then adapt strategies well before it’s too late.

InsightSquared Activity Capture
Automatically sync deal activity and engagement levels so you can truly analyze your sales process.
Activity data is the number one indicator of sales outcomes. So we automate, connect and write-the full team’s activities back to your CRM. Discover exactly what activities your sales team has completed, the steps they missed, and how prospects responded, so you can drive more consistent, predictable results.
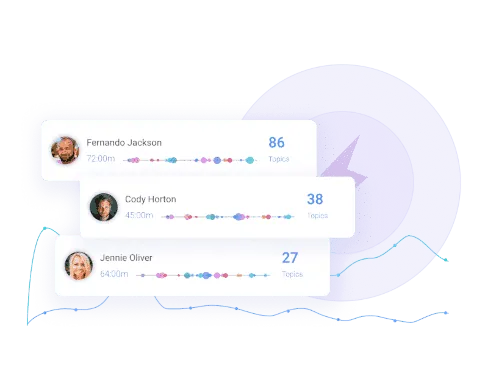
Conversation Intelligence and Call Recording
Capture the rich, unfiltered data from real-time conversations.
Understanding what your top reps do differently has never been easier. Record, transcribe and analyze every customer call across the entire sales journey. Capture transcripts, keywords, trends, and talk time. Then combine conversation data with full-lifecycle activity capture and robust machine learning, to enrich every element of your business – forecasts, reporting, product roadmaps, marketing campaigns, competitive positioning, and more.
![]()
Guided Selling and Sales Coaching
Turn coaching from reactive to proactive by giving your team their own virtual assistant.
Put your reps and account managers on the fastest path to success with in-the-moment guidance based on best practices, key steps in your sales process as well as machine learning. Customize by person, role, opportunity type, or any field. Scale best practices learned from top players. Onboard quickly. And hold everyone accountable by tracking through completion.

The Best of the Best!
See Revenue Intelligence in action.
Demo Revenue Forecasting & Analytics today
