Staffing Analytics
Actionable Dashboards & Analytics for Bullhorn. Say goodbye to static data and reactive reporting and hello real-time activity insights that drive the behaviors you want in your organization.
More than 10,000 staffing leaders around the world use InsightSquared to run their businesses and drive more placements.

Do you know which open job orders are stalling?
What do top performers do differently?
Do you have enough pipeline to cover your revenue target?
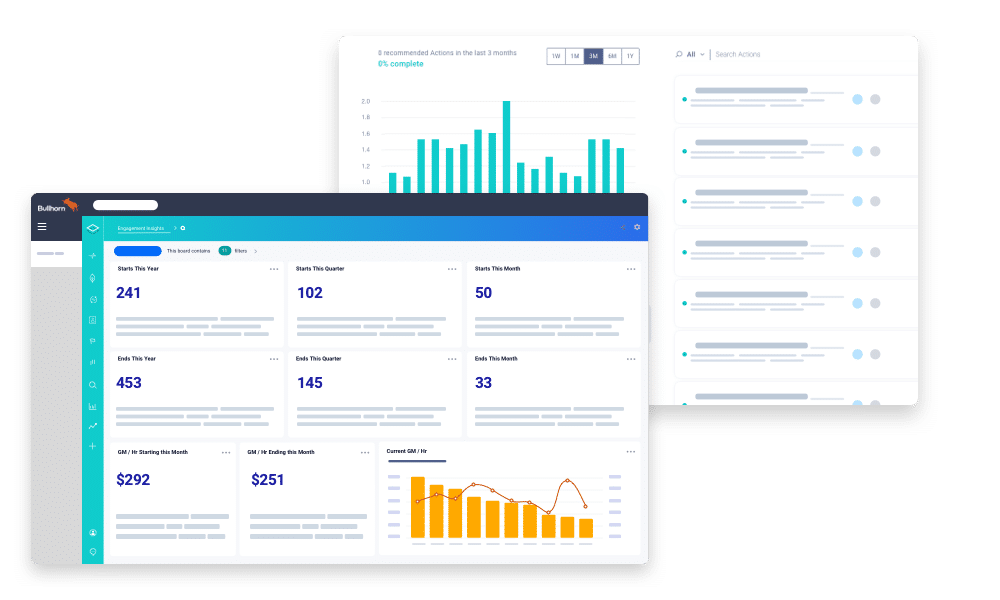
ACTIVITY REPORTING
Understand how and why you win.
Every staffing and recruiting leader knows activity drives results. Yet, for too long we’ve relied on volume as the key metric—rather than effectiveness. Changing rep behavior and increasing revenues start with understanding how activity correlates with fill rates. Once you know which activities matter most, managers and recruiters can prioritize the right activities at the right times in their business.

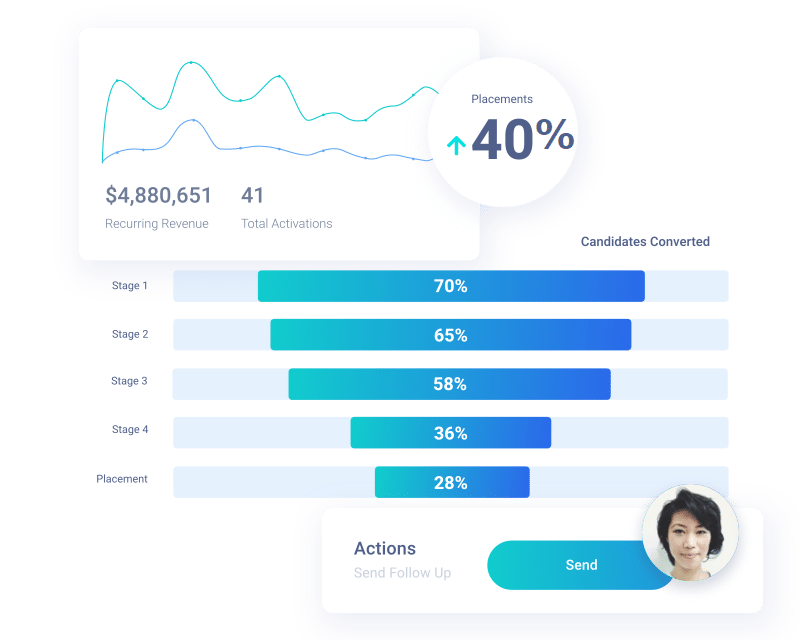
REP COACHING
Enable reps to manage jobs effectively.
Sales & recruiters want to be empowered. Yet, static reports leave them in the dark, relying on gut-feel to determine what they should do next and where they should be spending their time.
Give reps the data and insights they need to consistently hit their targets. We’re talking risk alerts, stale clients, jobs, placements, and candidates that need attention and more. This data exists in Bullhorn, are you taking advantage of it today?
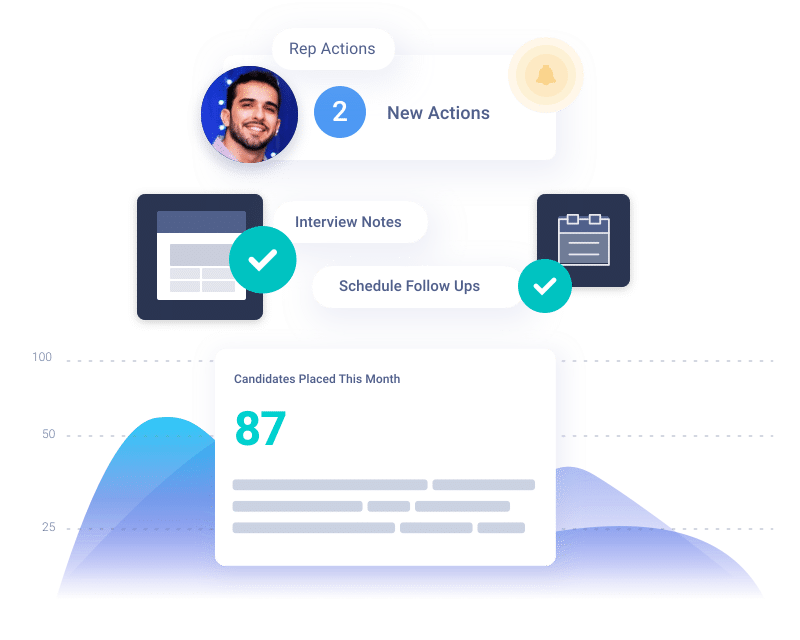
EMBEDDED
Manage all your Bullhorn data in one place
Finally all your data at your fingertips. By connecting to your Bullhorn instance, InsightSquared provides a one-stop-shop to answer any question you have—clients, candidates, leads, opportunities, jobs, or placements. Deep visibility, flexible reports. All without leaving Bullhorn.
Experience the new InsightSquared Platform for Bullhorn.
Best-in-class activity reporting, dashboards and machine-learning insights that drive more placements and revenue!
