Sales Analytics
Real-time reporting with unparalleled sales intelligence in one intuitive view.

Can you conduct detailed win/loss reports?
Do you know the full story behind every deal?
Can you easily create and share Board reports?
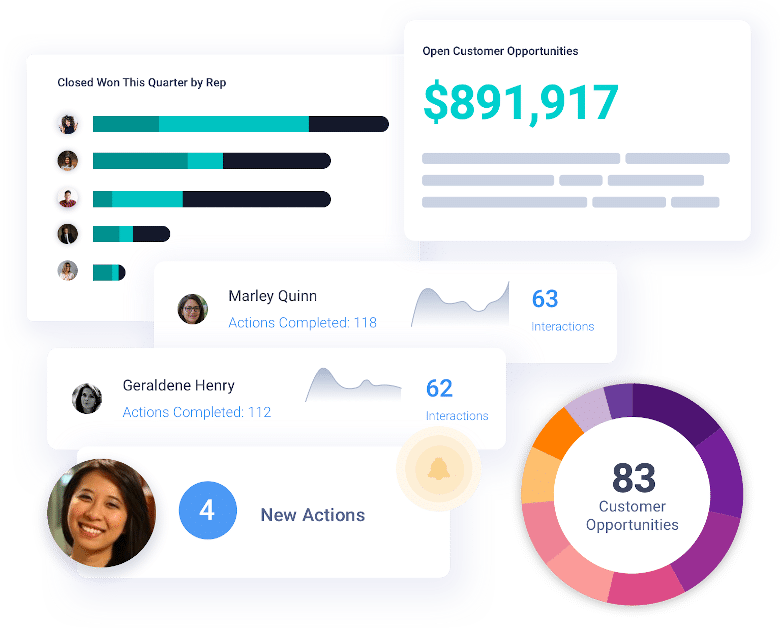
BOARD-LEVEL
Track results with total precision.
Your results are only meaningful if you understand the story behind them. Get high-level, real-time dashboards with data-backed answers to every sales question (win or lose). Then break results down to the rep level to see detailed analysis into the “why” behind the outcome.
We help you visualize sales funnels by company, product line, time period, and individual rep to identify patterns that can help you improve sales efficiency. Monitor performance as you go with at-a-glance comparisons of bookings against goals and more.

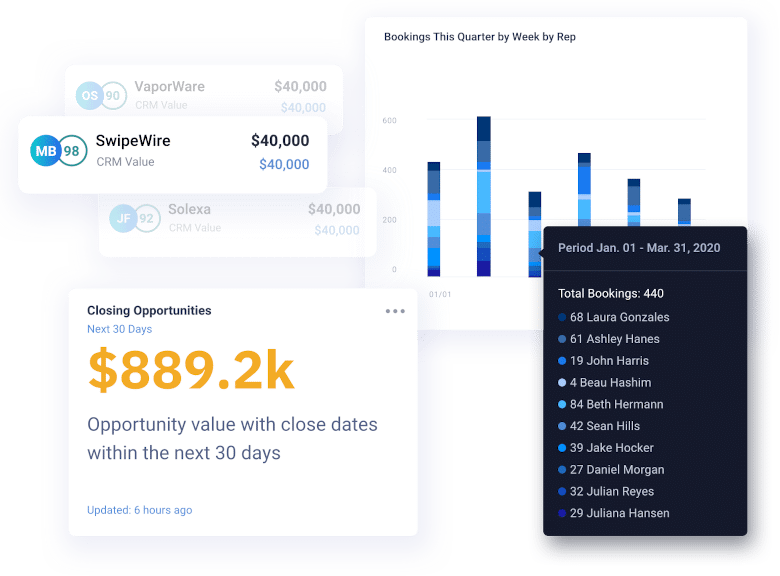
PIPELINE MANAGEMENT
Manage your entire pipeline from one central dashboard.
Eliminate data silos so you can manage your pipeline confidently and efficiently. We bring all data sources together for you to review your entire pipeline across any dimension, understanding changes and risk before it’s too late.
Drill into your pipeline at any level and receive intuitive analysis that helps you understand changes to your pipeline and the reasons behind them. These reports can be generated at any time and provide a single source of truth for your entire organization.
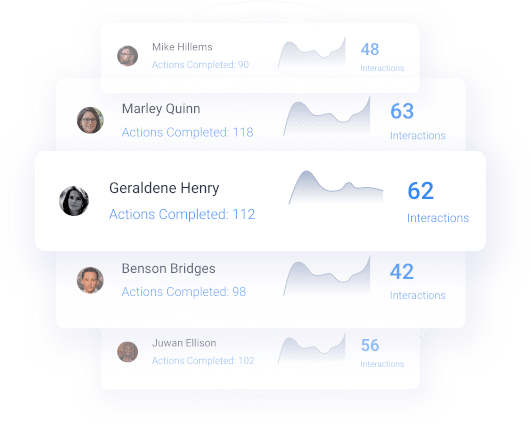
SALES PERFORMANCE
Know exactly which teams, reps and activities are driving results.
Never miss a beat of your rep and team’s progression. Easily review performance and understand progress relative to peers. Find out who is leading the pack and who could use more coaching.
Break down per-account activity over time, giving you a more granular view into which activities and cadences best resonate with specific accounts. This enables you to plan out each playbook in a more prescriptive manner and see results faster.
See Revenue Intelligence in action.
Schedule a demo of our 6 in 1 platform today!
