
As CEO of InsightSquared, I am extremely excited to share that Mediafly, the leader in sales enablement, is acquiring InsightSquared, creating a world-class revenue intelligence and enablement experience for B2B teams. Having spent three decades in sales and marketing leadership roles and been fortunate to witness several significant disruptions driven by technology, I am convinced of three things: We are on the cusp of advancements that will change the game within the revenue functions of B2B companies. Activity and engagement analytics are the keys to assessing the health of a deal and the strength of the overall pipeline. There will…
Looking for Sales Dashboard examples and templates? You’re not alone.
Everyone wants to be data-driven.
But too many people take the wrong approach when it comes to analytics – they lack focus and intent. They report reactively, as opposed to monitoring the data in real-time, even better, predicting, so they can coach and optimize.
Why Use Sales Dashboards?
Sales teams move fast. And their progression towards goals impacts almost every area of the business. From marketing to implementation, product to finance. On a daily basis, revenue leaders have critical questions they must answer — and the answers must be rooted in the data.
So what’s the best way to adopt a data-driven philosophy? It’s all about asking the right questions.
That’s why sales dashboards are so useful to sales leaders – they provide data-backed answers to specific questions with the click of a button.
What are Great Examples of Sales Dashboards?
We compiled this list of 7 sales dashboard examples and templates to help you think about the questions you should be considering. Each designed to match a certain role and answer pertinent questions.
These are real sales dashboards used by real sales leaders here at InsightSquared. And all are available out-of-the-box, to make life easier for data-driven people like you!
To start thinking about what your dashboard should look like, check out the 7 role-based sales dashboard examples and templates below.
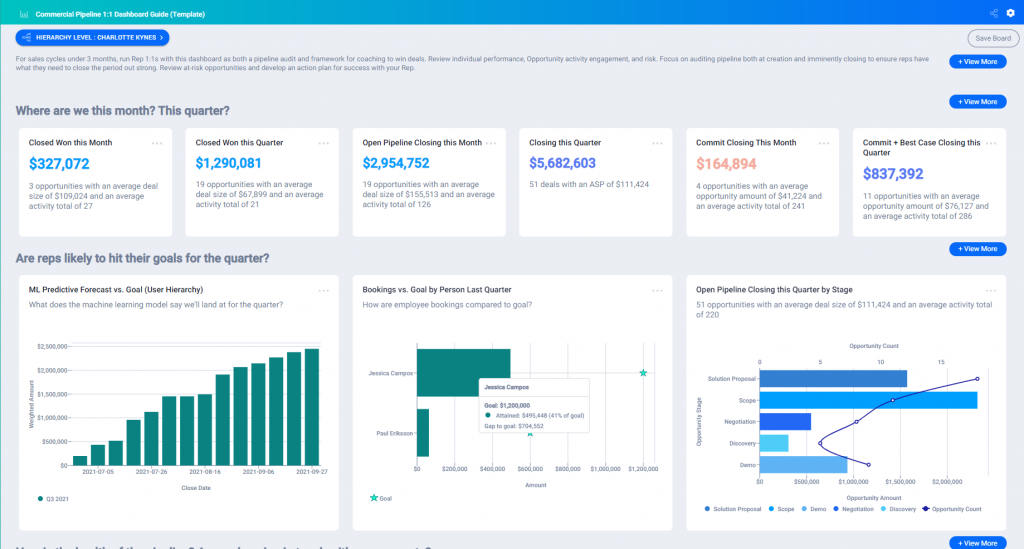
Pipeline 1:1 Dashboard
Who uses this dashboard: Front Line Sales Managers & Reps
Why use this dashboard:
- Ensure Reps have what they need to effectively manage their territory, from start to end of period
- Visualize the pipeline health by Rep to support current goals and future coverage
- Spotlight at-risk opportunities to develop an action plan to win
Easily answer questions like:
- What opps are engaged?
- How healthy is the team & rep pipeline?
- How are we progressing towards our goal?
- Do we have enough pipeline?
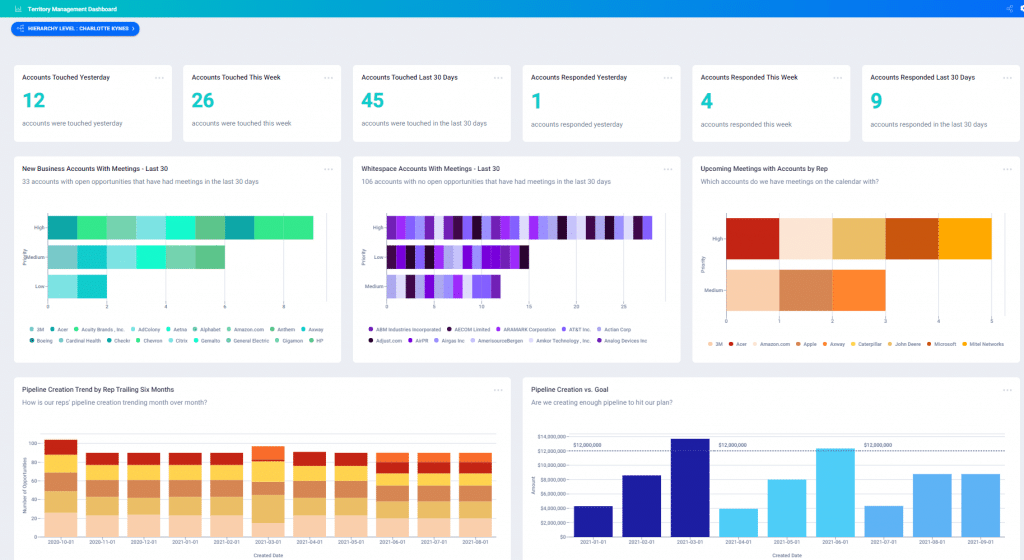
Territory Engagement Dashboard
Who uses this dashboard: Front Line Sales Managers & Reps
Why use this dashboard:
- Ensure Reps are engaging their entire territory, not just their committed opportunities
- Improve pipeline hygiene, spotting out of date and incomplete fields
- Visualize the territory health, across both the Account and Contact levels
- Spotlight engaged accounts that should have opportunities opened.
Easily answer questions like:
- What accounts are reps actively working?
- How healthy is my team & reps territories?
- Do we have enough accounts?
- Is the sales team working effectively in their territory?
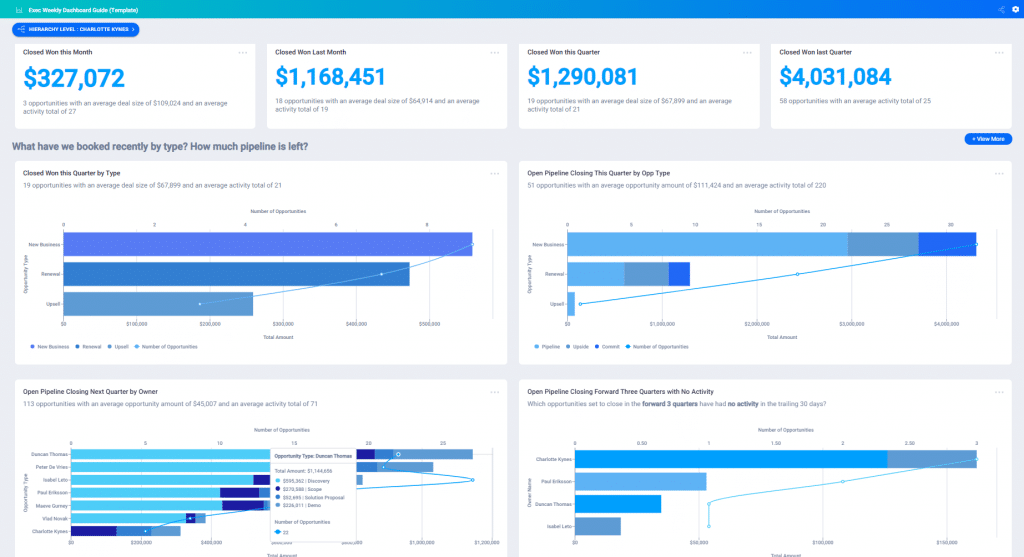
Executive Team Weekly Review
Who uses this dashboard: Executive Team & Sales Leadership
Why use this dashboard:
- Provide a data-driven framework for reviewing key metrics for the business; key focus areas for the period
- Ensure Leadership is aligned and has visibility into what’s required to close the period strong
- Visualize the health of the business
Easily answer questions like:
- How are our key KPIs trending?
- Are we progressing towards bookings goals?
- Is the pipeline healthy?
- How has the forecast and pipeline changed? And why?
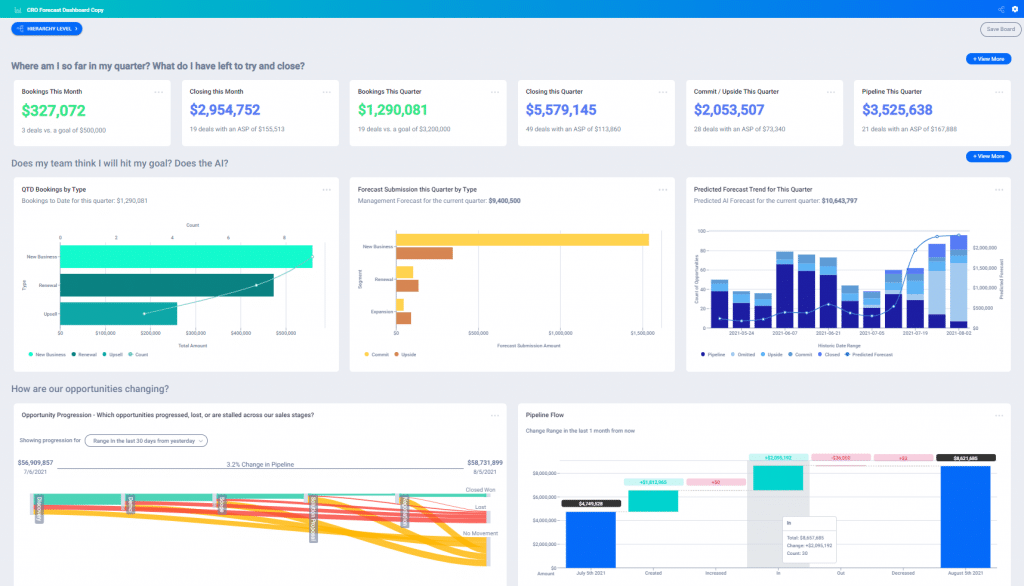
CRO Forecast Review
Who uses this dashboard: Chief Revenue Officer
Why use this dashboard:
- Provide Board-Level visibility into pipeline health and the trajectory of the forecast
- Improve predictability and ensure you are on track to meet or exceed your number
- Proactively spotlight risk in the plan
- Align leadership on what needs to happen to make plan]
Easily answer questions like:
- What has changed in the forecast?
- How does our roll-up compare to the predicted forecast?
- Where is the risk in the plan?
- How has the pipeline progressed & changed?
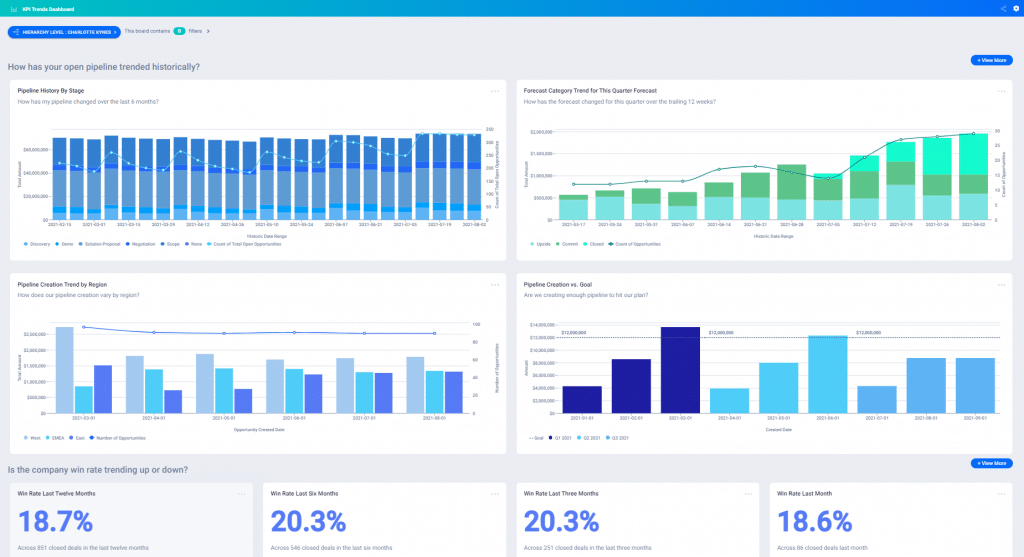
KPI Trends Dashboard
Who uses this dashboard: Sales Operations & Sales Leadership
Purpose of this dashboard:
- Spotlight trends in key performance indicators
- Understand win rates, ASP, bookings to date to easily track trends
- Discover key inflection points in your data to better focus sales efforts
- Identify optimization opportunities by analyzing large drop-offs in conversion metrics
Easily answer questions like:
- How have our sales cycle & conversion metrics changed?
- Is pipeline growing and from where?
- What are the activities driving the sales process?
- How is the forecast changing (WoW & MoM)?
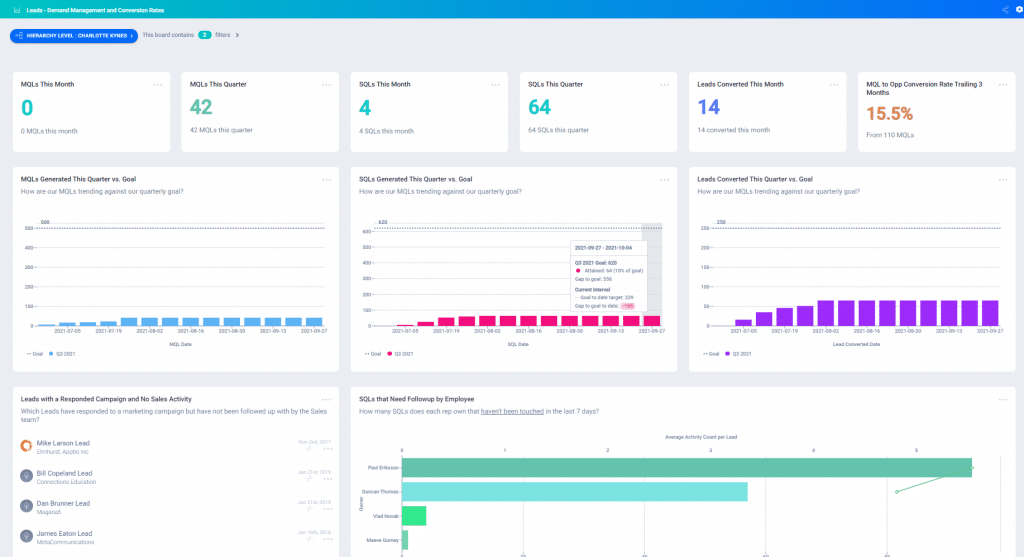
Leads – Demand Management and Conversion Rates
Who uses this dashboard: Marketing & SDR leadership
Why use this dashboard:
- Provide visibility into demand trends, including marketing campaign performance, demand volume.
- Ensure the team is generating enough leads to drive opportunity creation for both this and next period
- Visualize the health of demand over time
- Understand the most effective campaigns and sources of demand
Easily answer questions like:
- Are we engaging with our leads?
- Do we have enough leads?
- How are we trending towards our MQL targets?
- How are our lead conversions trending?
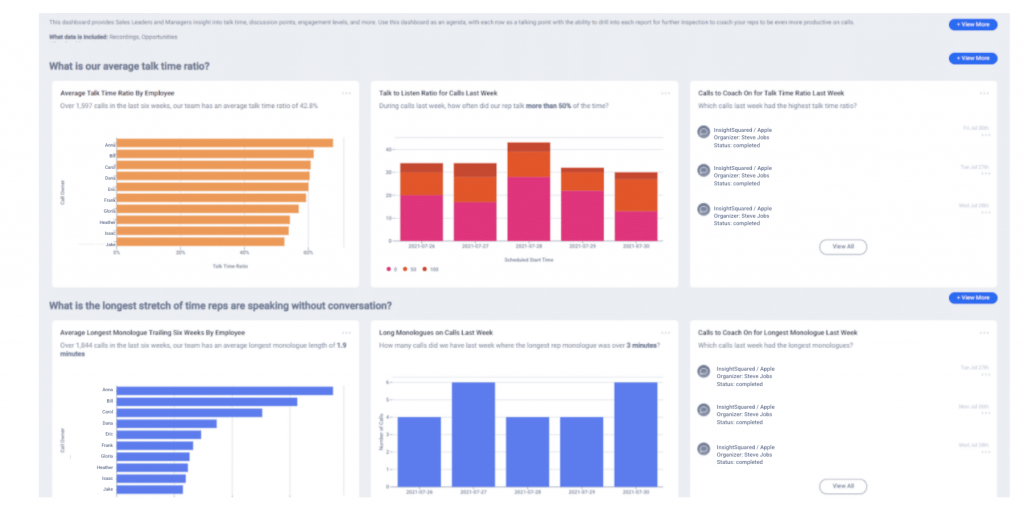
Coaching on Conversations
Who uses this dashboard: Sales Leaders, Managers, Marketing, & Product
Why use this dashboard:
- Provide incredible insight into talk time, discussion points, discovery work, and more to best determine where the team needs coaching
- Help identify specific calls that can be used to coach the team
- Review major metrics that result in successful calls (ex. when in the sales process is pricing mentioned, where are reps able to elicit strong customer stories, etc.)
- Show week-over-week data to ensure progression towards key call metrics
Easily answer questions like:
- Which reps need coaching and where? (competition or talk time)
- Which features gaps are consistently discussed, and could they be addressed by product?
- What are the week over week trends discussed in calls?
- Are specific objections coming up more often that require enablement and more training?
No matter your role on the sales team, dashboards will make your life easier by uncovering opportunities for improvement. Don’t be left wondering how your sales team is performing; get the answers you need with the click of a button.
More Sales Dashboard Resources
Interested in learning more about these sales dashboard examples and templates that we put together for your convenience Check out our library of 350+ out-of-the-box dashboards, or request a demo to see InsightSquared live.
You Might Also Like…

Mediafly & InsightSquared join forces to help revenue teams improve forecast accuracy, enhance buyer engagement and increase revenue production. Mediafly, a leader in sales enablement, interactive content and value selling, today announced it has entered into a definitive agreement to acquire InsightSquared, a leader in revenue intelligence, forecasting and analytics. The combined revenue enablement and intelligence platform, a first of its kind, provides customers a 360-degree view of what’s happening at every stage, in every account to improve coaching, engagement, predictions and execution throughout the customer journey. Despite a digital-first selling environment, today’s B2B revenue leaders forecast, prioritize and create…
Is your sales team getting the most out of their data? If you’re like most companies, the answer is, unfortunately, probably not. In fact, a 2018 study by Gartner indicated that a whopping 87% of organizations have low business intelligence and analytics maturity. Yes, you read that right. Almost 90% of companies aren’t benefiting from their data in all the ways they could—and should—be. So what’s the answer to this problem, and how do you develop better business intelligence and data maturity? It’s a pretty big issue to solve with any one strategy. However, using sales metrics dashboards that are…
